
Published IH and IHC Pictures for 26903 Rac1-GTP mAb - Part 02
2.1. Clinical samples
Surgical specimens were routinely fixed in 10% formalin and embedded in paraffin. Two pathologists (MY and SM) reviewed all SCC specimens obtained during 2014–2016 and subsequently selected 10 cases of SCC with prominent phagocytic figures. Serial sections (4-μm thick) were prepared from the paraffin blocks for hematoxylin and eosin staining and immunohistochemistry. The percentages of SCC cells showing intracellular apoptotic cells to total SCC cells (at least 500 cells) were obtained by selecting three foci of hot spots within the tumor area.
2.4. Immunohistochemistry and TdT-mediated dUTP nick-end labeling (TUNEL)
Immunohistochemical analysis of paraffin sections was performed using the Chem-Mate Envision™ System (Dako), as described previously [8]. Briefly, deparaffinized sections were autoclaved in citrate buffer (pH 6.0) for 10 min at 121 °C for antigen retrieval. The in situ detection of apoptotic cells in formalin-fixed paraffin sections was performed based on the TUNEL method using the POD In Situ Cell Death Detection Kit (Roche Diagnostics GmbH, Mannheim, Germany) [8].
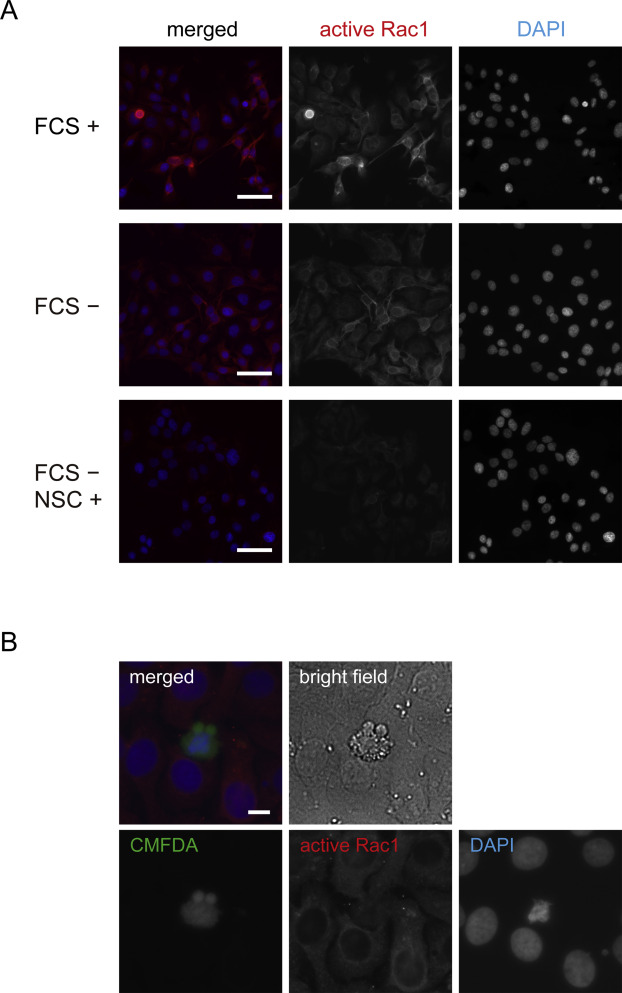
Figure 2. (A) Immunofluorescent staining for active Rac1 in Ca9-22 cells cultured in the media containing 10% FCS (upper panel), FCS-free media without NSC23766 (middle panel), and with NSC23766 (lower panel) for 48 h. Scale bar, 50 μm. (B) Immunofluorescent staining for active Rac1 in phagocytosis assays using Ca9-22 cells. Scale bar, 10 μm.
2.1. Clinical samples
Surgical specimens were routinely fixed in 10% formalin and embedded in paraffin. Two pathologists (MY and SM) reviewed all SCC specimens obtained during 2014–2016 and subsequently selected 10 cases of SCC with prominent phagocytic figures. Serial sections (4-μm thick) were prepared from the paraffin blocks for hematoxylin and eosin staining and immunohistochemistry. The percentages of SCC cells showing intracellular apoptotic cells to total SCC cells (at least 500 cells) were obtained by selecting three foci of hot spots within the tumor area.
2.4. Immunohistochemistry and TdT-mediated dUTP nick-end labeling (TUNEL)
Immunohistochemical analysis of paraffin sections was performed using the Chem-Mate Envision™ System (Dako), as described previously [8]. Briefly, deparaffinized sections were autoclaved in citrate buffer (pH 6.0) for 10 min at 121 °C for antigen retrieval. The in situ detection of apoptotic cells in formalin-fixed paraffin sections was performed based on the TUNEL method using the POD In Situ Cell Death Detection Kit (Roche Diagnostics GmbH, Mannheim, Germany) [8].
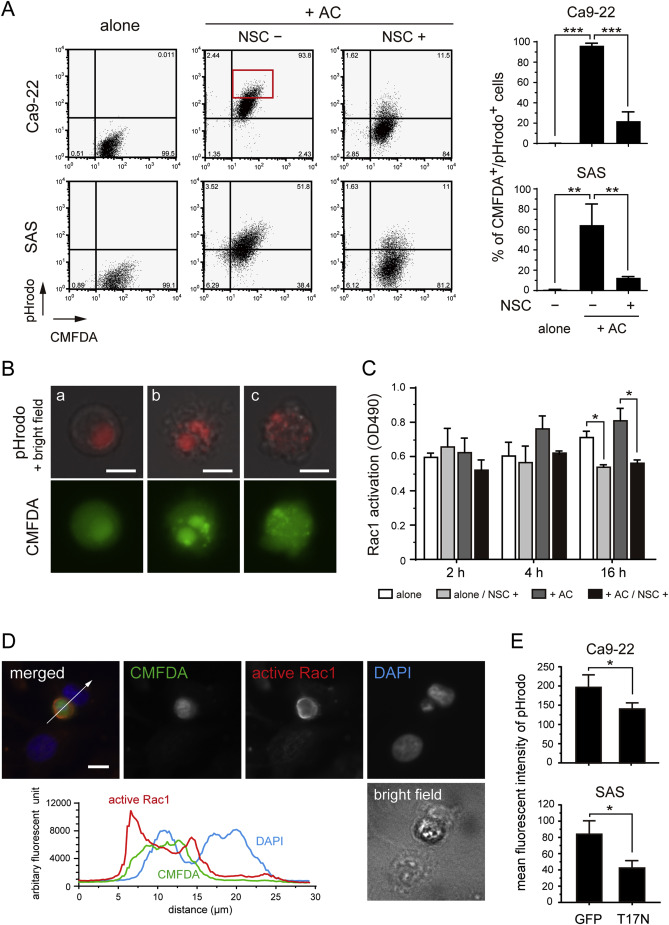
Fig. 4. The phagocytosis of apoptotic cells is mediated by Rac1 activation.
(A) The representative data for quantitative analysis of the phagocytosis of apoptotic cells by Ca9-22 and SAS cells using pHrodo labeling. Culture of CMFDA-labeled cells alone (left); co-culture with apoptotic cells (+AC) labeled with pHrodo in the presence of dimethyl sulfoxide (vehicle controls) (middle) or with the Rac1 inhibitor NSC23766 (right). Bar charts indicate the percentage of CMFDA+/pHrodo+ cells from triplicate experiments. **P < 0.01, ***P < 0.001. (B, a–c) Fluorescent microscope images of Ca9-22 cells isolated from the CMFDA+/pHrodo+ fraction (A, red rectangle) by flow cytometric sorting. Shown are merged bright field (gray) and pHrodo (red) images (upper panel), and CMFDA (lower panel). pHrodo signals were also detected in the CMFDA channel, because their intensities were much higher than CMFDA fluorescence. Scale bars, 10 μm. (C) Quantitification of Rac1 activation using G-LISA® Rac1 activation assays. Experiments were performed in triplicate. Open box indicates Ca9-22 cells cultured alone; light-shaded box cells cultured alone in the presence of NSC23766; dark-shaded box cells co-cultured with apoptotic cells (+AC); solid box cells with apoptotic cells in the presence of NSC23766. *P < 0.05. (D) Immunofluorescence staining for active Rac1 in Ca9-22 cells co-cultured with apoptotic Ca9-22 cells for 4 h. Green, CMFDA-labeled apoptotic Ca9-22 cells; red, active Rac1; blue, DAPI. Scale bar, 10 μm. The graph displays the co-localization of fluorescence signals given in arbitrary fluorescence units. White arrow in the merged image indicates the location of the cross-section corresponding to the fluorescence diagram. (E) Bar charts indicating the mean fluorescent intensity of pHrodo on GFP- or EGFP-Rac1T17N-positive fractions. *P < 0.05.
Immunofluorescence microscopy, immunoprecipitation and western blotting
Cells were fixed in methanol/acetone (1:1) with exception of samples processed for Rac-GTP labeling, which were fixed in 2% formalin and permeabilized with 0.1% Triton X-100. Processing of samples was carried out as described previously.19 Antibodies used for immunofluorescence were: rabbit anti-GIT2;19 rabbit anti-DOCK5 (described above); rabbit anti-DOCK1 ; mouse anti-paxillin ( clone 349), mouse anti-ARP3 (clone FMS338); mouse anti-Rac-GTP (NewEast Biosciences, Malvern, PA, USA, clone 26903); and mouse anti-Myc epitope ( clone 9B11). Confocal images were acquired using a spinning disk confocal microscope.
- Frank SR, Adelstein MR, Hansen SH. GIT2 represses Crk- and Rac1-regulated cell spreading and Cdc42-mediated focal adhesion turnover. EMBO J 2006; 25: 1848–1859. [PMC free article] [PubMed] [Google Scholar]
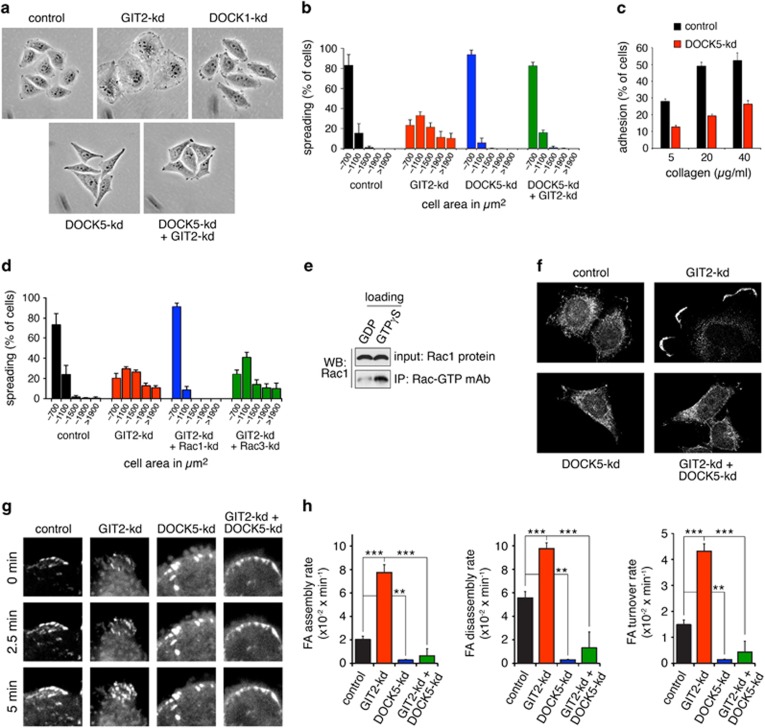
(a) Phase contrast images of control, GIT2-kd, DOCK1-kd, DOCK5-kd and GIT2-kd+DOCK5-kd cells cultured on collagen. (b) Quantification of cell area occupied by control, GIT2-kd, DOCK5-kd and GIT2-kd+DOCK5-kd HeLa cells 1 h after plating on collagen. (c) Control and DOCK5-kd cells were plated on collagen and assayed for adhesion after 1 h. All values are means±s.d. (n=3). (d) Quantification of the distribution of areas occupied by control, GIT2-kd, GIT2-kd+Rac1-kd and GIT2-kd+Rac3-kd HeLa cells 1 h after plating on collagen. (e) Specificity of NewEast Biosciences antibody for Rac-GTP. Recombinant Rac1 was loaded with either GDP or GTPγS followed by immunoprecipitation with monoclonal antibody to Rac1-GTP and western blotting. (f) Localization of Rac-GTP in control, GIT2-kd, DOCK5-kd and GIT2-kd+DOCK5-kd cells 1 h after plating on collagen. (g) FA turnover in live HeLa cells expressing paxillin-GFP. Representative confocal images illustrate FA formation over times indicated in control, GIT2-kd, DOCK5-kd and GIT2+DOCK5-kd cells grown on glass. (h) Rate (min−1) of assembly, disassembly and turnover of FAs as measured by change in GFP fluorescence over time for control, GIT2-kd, DOCK5-kd and GIT2+DOCK5-kd Hela cells, ***P<0.001, **P<0.002, analysis of variance with Tukey–Kramer post hoc testing.
Immunofluorescence analysis
Dissected embryos were fixed with 4% paraformaldehyde for 30 min on ice, dehydrated with methanol or permeabilized for 20 min at room temperature with 0.2% Triton X-100 in phosphate-buffered saline (PBS). For immunofluorescence staining of pMLC, embryos were instead fixed for 30 min on ice with 4% paraformaldehyde in PBS also containing 0.5% Triton X-100 and 50 nM calyculin A before immunostaining. All embryos were then stained overnight at 4°C with the following primary antibodies at the indicated dilutions: E-cadherin (mouse monoclonal, 1:100; M108), Ser19-phosphorylated myosin light chain 2 (rabbit polyclonal, 1:100; 3675), ZO1 (mouse monoclonal clone ZO1-1A12, 1:200; Invitrogen), Odf2 (rabbit polyclonal, 1:200; Abcam, ab43840), Vangl1 (rabbit polyclonal, 1:200; Sigma-Aldrich, HPA025235), γ-tubulin (clone GTU-88, mouse monoclonal, 1:200; Sigma-Aldrich, T5326), Vangl2 (rabbit polyclonal, 1:250; Sigma-Aldrich, HPA027043), GFP (chicken polyclonal, 1:300; Abcam, ab13970), Dchs1 (rabbit polyclonal, 1:100; kindly provided by Masatoshi Takeichi, RIKEN Center for Biosystems Dynamics Research, Japan) and active Rac1 (mouse monoclonal, 1:500; NewEast Bioscience, 26903). Fluorescein isothiocyanate (FITC)-conjugated α-tubulin antibodies (mouse monoclonal, 1:100; Sigma-Aldrich, F2168) and Alexa Fluor 568-labeled Phalloidin (1:50, Thermo Fisher Scientific, A12380) were also used to detect to α-tubulin and F-actin, respectively. The embryos were washed with PBS containing 0.01% Triton X-100 before exposure to Alexa Fluor-conjugated secondary antibodies. The following secondary antibodies were used: Alexa Fluor 568, goat anti-mouse IgG H&L (Invitrogen, A11004, 1:200), Alexa Fluor 488, goat anti-rabbit IgG H&L (Invitrogen, A11034, 1:200), Alexa Fluor 594, goat anti-rabbit IgG H&L (Abcam, ab150084, 1:200), Alexa Fluor 488, goat anti-chicken IgY H&Y preadsorbed (Abcam, ab150173, 1:500), Alexa Fluor 594, donkey anti-rat IgG H&L preadsorbed (Abcam, ab150156, 1:200), Alexa Fluor 647, donkey anti-rat IgG H&L (Abcam, ab150159, 1:200) and Alexa Fluor 488, goat anti-mouse IgM mu chain (Abcam, ab150121, 1:500). The node of stained embryos was excised, placed on a glass slide with silicone rubber spacers, covered with a cover glass and imaged with an FV-3000 confocal microscope (Olympus). For immunofluorescence staining of microtubules, embryos were dissected in Hepes-buffered Dulbecco’s modified Eagle’s medium (pH 7.2) warmed to 37°C and were fixed for 30 min at 37°C with 4% paraformaldehyde in PEM buffer [100 mM Pipes-KOH (pH 6.9), 5 mM EDTA, 5 mM MgCl2] containing 50 mM sorbitol and 0.2% Triton X-100. They were washed twice in PBS containing 0.01% Triton X-100 for whole-embryo imaging as described previously (Minegishi et al., 2017). For preparation of frozen sections of the node, the embryos were transferred to a series of sucrose solutions (15-30%) and then frozen in OCT compound (Sakura Finetek). Sections were cut at a thickness of 4-5 μm using a CRYOSTAR NX70 instrument (Thermo Fisher Scientific) and then immunostained as described previously (Toya et al., 2016). Immunostained specimens were sealed with ProLong Glass Antifade Mountant (P36983, Invitrogen) and images were acquired using a Zeiss LSM880 microscope equipped with Airyscan laser scanning confocal microscope equipped with an Axio Observer Z1 inverted microscope, using a Plan-APOCHROMAT 63× Oil for SR objective lens (Zeiss).
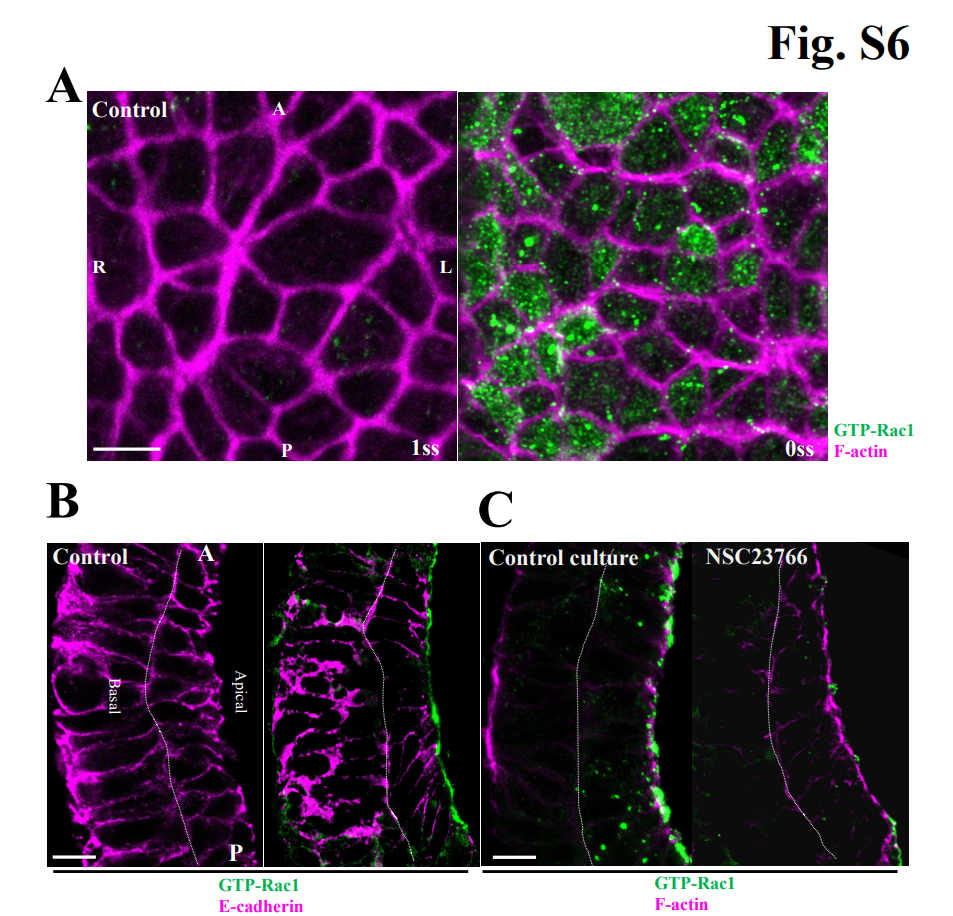
Fig. S6. Subcellular localization of GTP-Rac1 in node cells.
(A) WT mouse embryos at the 0- or 1-somite stages were stained for F-actin (magenta) and GTP-Rac1 (green) and were observed from the apical side of the node by super-resolution imaging. GTP-Rac1 signals were detected in the apical cytosolic region of node cells as dots. Such dots were not observed for embryos stained without antibodies to GTP-Rac1 (control). A, anterior; P, posterior; L, left; R, right. (B) Sagittal sections of mouse embryos at the 3-somite stage were stained for E-cadherin (magenta) and GTP-Rac1(green) and were observed by super-resolution microscopy. GTP-Rac1 signals were detected at the apical membrane, but they were again not observed for embryos stained without antibodies to GTP-Rac1 (control). (C) Mouse embryos at the late bud stage were cultured in the absence (control) or presence of 150 µM NSC23766 for 10 h to allow their development to the 3-somite stage. Sagittal sections were then stained for F-actin (magenta) and GTP-Rac1 (green). GTP-Rac1 signals were attenuated by NSC23766. All scale bars, 5 μm.
Immunostaining
Differentiated HL-60 cells were resuspended in mHBSS and attached to fibrinogen-coated slides for 30 min. Cells were stimulated with 100 nM fMLP for 3 min and fixed with 3% paraformaldehyde in PBS for 15 min at 37°C. The immunostaining of fixed cells were performed as described previously (Fayngerts et al., 2017). Briefly, cells were permeabilized in PBS with 0.1% Triton X-100 and 3% BSA for 1 h at room temperature. Differentiated HL-60 cells were incubated with phalloidin–AlexaFluor 488 or primary antibodies diluted 1:100 in 3% BSA overnight at 4°C. The cells were then stained with secondary antibodies diluted 1:500 in 3% BSA and DAPI for 1 h at room temperature. For MEF staining, cells were plated on fibrinogen-coated slides and incubated for ∼4 h at 37°C, followed with fixation with 3% paraformaldehyde in PBS.
Fayngerts S. A., Wang Z., Zamani A., Sun H., Boggs A. E., Porturas T. P., Xie W., Lin M., Cathopoulis T., Goldsmith J. R. et al. (2017). Direction of leukocyte polarization and migration by the phosphoinositide-transfer protein TIPE2. Nat. Immunol. 18, 1353-1360. 10.1038/ni.3866 [PMC free article] [PubMed]
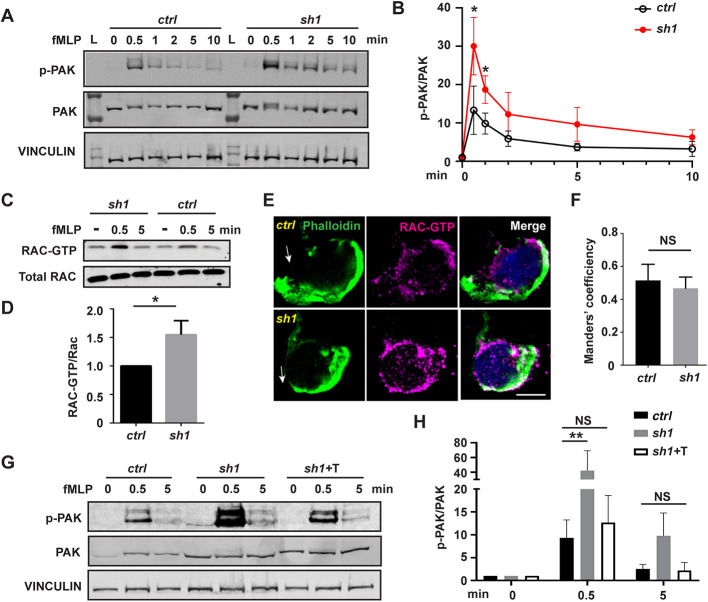
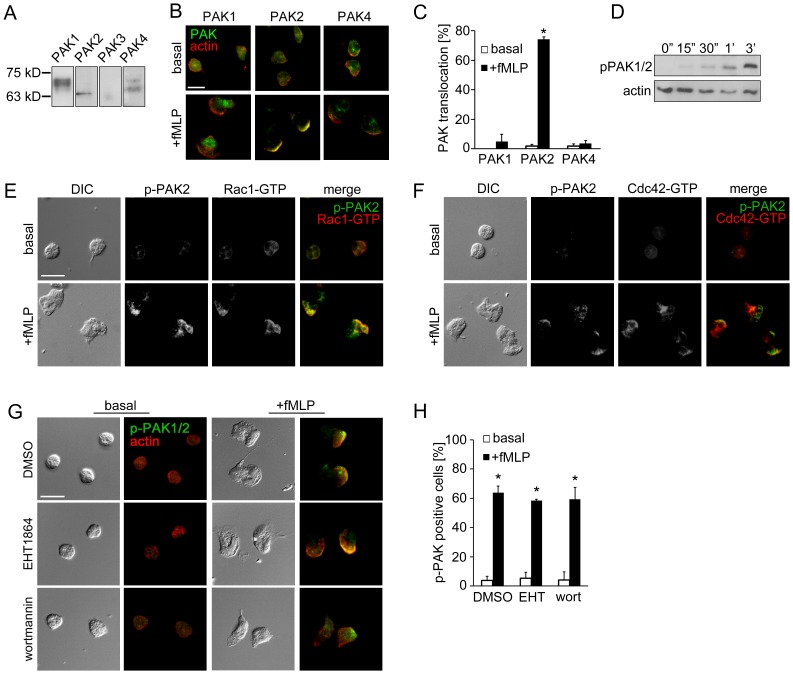
(A) Western blot and (B) quantification determining the amount of phospho-PAK (pPAK) in dHL-60 cells treated with fMLP at indicated time points. L, protein ladder. (C) Western blot determining the amount of Rac-GTP and total Rac protein in dHL-60 cells treated with fMLP at indicated time points. (D) Quantification of Rac activation 5 min after stimulation with fMLP. (E) Immunofluorescence of F-actin and Rac-GTP in indicated cell lines 3 min after stimulation with fMLP. Arrows, direction of cell polarization. (F) Colocalization of Rac-GTP and F-actin. n>20. (G,H) Western blot (G) and quantification (H) determining the amount of pPAK in dHL-60 cells treated with fMLP at indicated time points. One representative result of three biological repeats is shown in A,C, and G. Data are pooled from three independent experiments in B, D and H. Error bars represent s.d. NS, non-significant; *P<0.05; **P<0.01 [unpaired t-test (B,D), and two-way ANOVA (H)]. Scale bar: 10 µm
Immunohistochemistry (IHC) and immunocytochemistry (ICC)
Paraffin-embedded and/or frozen uterine sections were subjected to immunohistochemistry as described previously [20]. Briefly, tissues were collected and fixed in 10% NBF for 18–24 h or flash frozen in liquid nitrogen. Fixed tissues were embedded in paraffin, sectioned at 5 μm, mounted on glass slides, and incubated at 37°C overnight. Tissue sections were deparaffinized in xylene, rehydrated through a graded series of ethanol, and washed in tap water. For most of the immunostaining, antigen retrieval was performed in a pressure cooker in 10 mM sodium citrate buffer (pH 6.0) for 20 min and then the slides were cooled to room temperature. For RAC1-GTP, specifically, antigen retrieval was performed by incubating the slides in 10 mM sodium citrate buffer (pH 6.0) for 2 h at 80°C in a water bath. When frozen tissues were used, the sections were thawed at room temperature for 5 min and then fixed for 5 min in 10% NBF. For both paraffin-embedded and frozen tissues, washes between steps (three times for 5 min each) were done using 1x phosphate-buffered saline solution containing 0.05% Tween 20 (PBS-T). Nonspecific binding was inhibited by incubating the sections with 10% normal serum for 1 h at room temperature. After the serum block, sections were incubated overnight at 4°C with the diluted antibody solution in PBS-T containing 1% normal serum. Labeling was visualized by incubation with a fluorescent-tagged secondary antibody for 1 h at room temperature. All incubations were done using a humidified chamber protected from light. Slides were mounted using a mounting solution containing DAPI. Pictures were taken using the Olympus BX51 microscope equipped for fluorescent imaging and connected to a Jenoptik ProgRes C14 digital camera with c-mount interface containing a 1.4 Megapixel CCD sensor. Fluorescent images were processed and merged using Adobe Photoshop Extended CS6 (Adobe Systems).
Primary cultures of stromal cells were subjected to immunocytochemistry as described previously [31]. Briefly, cells were fixed in 10% NBF for 10 min, and then washed with PBS. Cells were then permeabilized using PBS containing 0.1% Triton X for 10 min at room temperature. Nonspecific binding was inhibited by incubating the sections with 10% normal serum for 1 h at room temperature. After the serum block, the cells were incubated overnight at 4°C with the diluted antibody solution in PBS containing 1% normal serum. Labeling was visualized by incubation with a fluorescent-tagged secondary antibody for 1 h at room temperature. One drop of mounting solution containing DAPI was added to each well to stain the nucleus. Pictures were taken using the Olympus Ix70 inverted microscope adapted to a Diagnostic Instrument digital camera containing a 2.0 Megapixel CCD sensor. Fluorescent images were merged and processed using Adobe Photoshop Extended CS6.
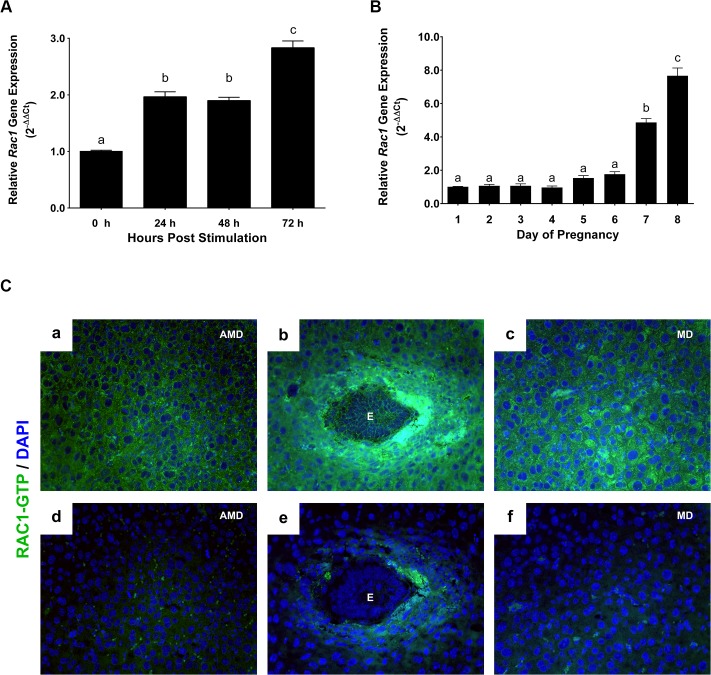
(A) …(B).. (C) Localization of active RAC1 protein in uterine stromal cells during early pregnancy. Uterine sections on day 7 of pregnancy were subjected to immunofluorescence (IF) histochemistry using anti-RAC1-GTP antibody. Panels a, b, and c show immunostaining of RAC1-GTP; panels d, e, and f show staining with non-immune IgG. AMD, MD and E indicate antimesometrial decidua, mesometrial decidua and embryo, respectively.
Immunohistochemistry (IHC) and immunocytochemistry (ICC)
Paraffin-embedded and/or frozen uterine sections were subjected to immunohistochemistry as described previously [20]. Briefly, tissues were collected and fixed in 10% NBF for 18–24 h or flash frozen in liquid nitrogen. Fixed tissues were embedded in paraffin, sectioned at 5 μm, mounted on glass slides, and incubated at 37°C overnight. Tissue sections were deparaffinized in xylene, rehydrated through a graded series of ethanol, and washed in tap water. For most of the immunostaining, antigen retrieval was performed in a pressure cooker in 10 mM sodium citrate buffer (pH 6.0) for 20 min and then the slides were cooled to room temperature. For RAC1-GTP, specifically, antigen retrieval was performed by incubating the slides in 10 mM sodium citrate buffer (pH 6.0) for 2 h at 80°C in a water bath. When frozen tissues were used, the sections were thawed at room temperature for 5 min and then fixed for 5 min in 10% NBF. For both paraffin-embedded and frozen tissues, washes between steps (three times for 5 min each) were done using 1x phosphate-buffered saline solution containing 0.05% Tween 20 (PBS-T). Nonspecific binding was inhibited by incubating the sections with 10% normal serum for 1 h at room temperature. After the serum block, sections were incubated overnight at 4°C with the diluted antibody solution in PBS-T containing 1% normal serum. Labeling was visualized by incubation with a fluorescent-tagged secondary antibody for 1 h at room temperature. All incubations were done using a humidified chamber protected from light. Slides were mounted using a mounting solution containing DAPI. Pictures were taken using the Olympus BX51 microscope equipped for fluorescent imaging and connected to a Jenoptik ProgRes C14 digital camera with c-mount interface containing a 1.4 Megapixel CCD sensor. Fluorescent images were processed and merged using Adobe Photoshop Extended CS6 (Adobe Systems).
Primary cultures of stromal cells were subjected to immunocytochemistry as described previously [31]. Briefly, cells were fixed in 10% NBF for 10 min, and then washed with PBS. Cells were then permeabilized using PBS containing 0.1% Triton X for 10 min at room temperature. Nonspecific binding was inhibited by incubating the sections with 10% normal serum for 1 h at room temperature. After the serum block, the cells were incubated overnight at 4°C with the diluted antibody solution in PBS containing 1% normal serum. Labeling was visualized by incubation with a fluorescent-tagged secondary antibody for 1 h at room temperature. One drop of mounting solution containing DAPI was added to each well to stain the nucleus. Pictures were taken using the Olympus Ix70 inverted microscope adapted to a Diagnostic Instrument digital camera containing a 2.0 Megapixel CCD sensor. Fluorescent images were merged and processed using Adobe Photoshop Extended CS6.
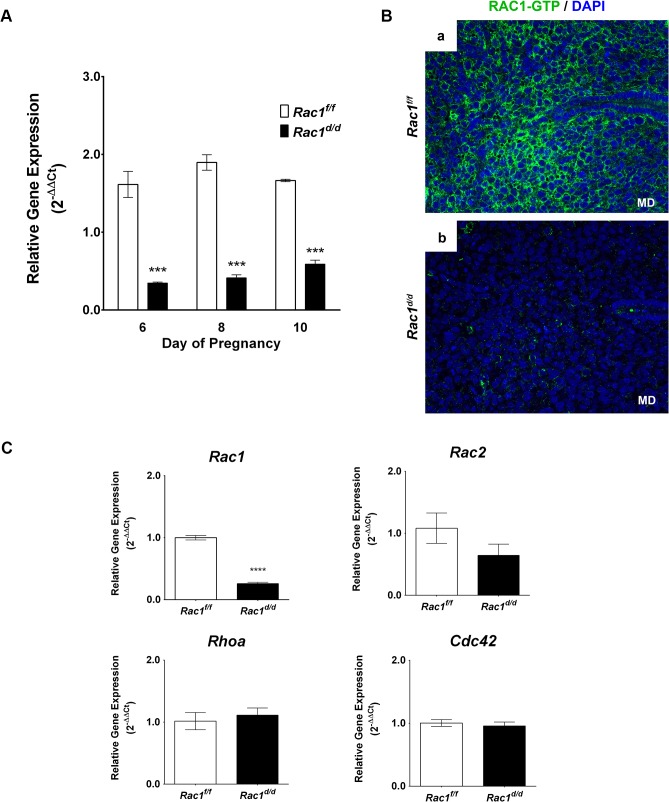
(A)… (B) A marked decline in the level of active RAC1 protein in the stromal cells of Rac1 d/d uteri. Uterine sections obtained from day 8 pregnant Rac1 f/f (left panel) and Rac1 d/d (right panel) mice were subjected to IF using anti-RAC1-GTP antibody. Note the lack of RAC1 immunostaining in uteri of the mutant mice. (C) ….
Immunofluorescence microscopy analysis
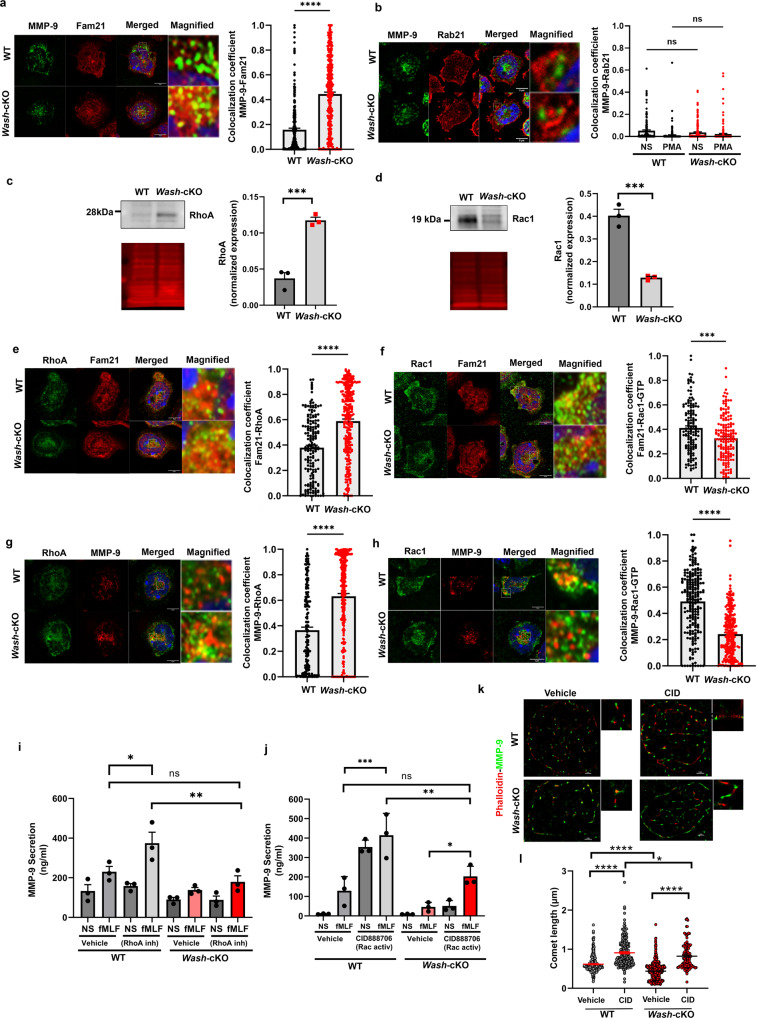
Neutrophils were seeded on untreated coverglasses using 4-Chamber 35 mm dish with 20 mm microwells (Cellvis LLC Cat # D35C4-20-1.5-N) and incubated at 37 °C for 30 min, then fixed with 3.7% paraformaldehyde for 8 min, permeabilized with 0.01% saponin, and blocked with 1% BSA in PBS. The samples were labeled with the indicated primary antibodies overnight at 4 °C in the presence of 0.01% saponin and 1% BSA. Samples were washed and subsequently incubated with appropriate secondary antibodies for 2 hours at room temperature. The cells were then stained with DAPI and mounted with Fluormount G. Where indicated, F-actin was labelled with 5 µl of a 6.6 µM concentration of Alexa 488- or Alexa 647-Phalloidin in 200 µl PBS with 0.05% Triton X-100. Samples were analyzed with a Zeiss LSM 880 laser scanning confocal microscope attached to a Zeiss Observer Z1 microscope at 21 °C, using a 63× oil Plan Apo, 1.4 numerical aperture (NA) objective. Where indicated, the images were collected using enhanced resolution microscopy (Airyscan) which generates images with substantially increased SNR (signal-to-noise ratio)61. Images were collected and fluorescence intensity and colocalization quantified using ZEN-LSM software. Actin colocalization at the edges of granules was analyzed using Manders’ correlation coefficient as described below.
a Immunofluorescence analysis of the localization of endogenous FAM21 at gelatinase granules (MMP-9). Left, representative Airyscan images of WT and Wash-cKO (Washc1Δhaemo) neutrophils; Right, Quantitative analysis from 3 independent mice. A total of 165 WT and 169 Wash-cKO cells were analyzed. Mean ± SEM. ****p < 0.0001. b Analysis of the localization of Rab21 at gelatinase granules. Left, representative Airyscan images of WT and Wash-cKO neutrophils; Right, Quantitative analysis from 3 independent mice. A total of 152 and 188 WT, and 205 and 176 Wash-cKO, not stimulated (NS) or stimulated (PMA) cells, respectively, were analyzed. Mean ± SEM. Immunoblot analysis of the endogenous expression of total RhoA (c) and Rac1 (d) in neutrophils. Left, representative immunoblots (grey) and total protein loading (red). Right, Mean ± SEM, 3 independent mice. c ***p = 0.001; d ***p = 0.0007. e, f Colocalization of endogenous RhoA and Rac1-GTP with FAM21, respectively, by immunofluorescence. Left, representative Airyscan images of WT and Wash-cKO neutrophils; Right, Quantitative analysis from 3 independent mice. Mean ± SEM. ***p = 0.0001 and ****p < 0.0001. A total of 99 and 103 (e) and 107 and 117 (f) WT and Wash-cKO cells were analyzed. g, h Immunofluorescence analysis of the localization of RhoA and Rac1-GTP at gelatinase granules (n = 3). ****p < 0.0001. A total of 176 and 269 (g) and 100 and 115 (h) WT and Wash-cKO cells were analyzed. a–h Scale bar: 5 µm. a–h Two-tailed unpaired Student’s t-test. Three independent experiments. i, j Effect of RhoA inhibition (cell-permeable C3 Transferase, 2 µg/m) and Rac1 activation (CID888706, 10 µM) on gelatinase granule exocytosis (MMP-9 secretion). Mean ± SEM, n = 3. i *p = 0.0428; **p = 0.0038; j *p = 0.0410; **p = 0.0037 and ***p = 0.0002; ns, not significant. Ordinary one-way ANOVA, Tukey’s multiple comparisons test. k, l Effect of Rac1 activation on the actin comet defective phenotype of Wash-deficient neutrophils. k STORM super resolution images of actin comets (phalloidin, red) at gelatinase granules shown as MMP-9 molecular clusters (green). Representative of the data analyzed in l from three independent mice. Scale bar: 1 µm. l Quantitative analysis of actin comet length described in k. Mean ± SEM, from the analysis of 17, 13, 18 and 12 cells and 292, 205, 498 and 128 comets, from wild-type, Rac1-activated wild-type, Wash-cKO and Rac1-activated Wash-cKO cells respectively. CID, CID888706. Ordinary one-way ANOVA, Tukey’s multiple comparisons test. One outlier value in the WT-vehicle group (Grubb’s alpha = 0.05), length = 4.3 µm, (out of scale). Where indicated, *p = 0.0168; ****p < 0.0001. ns, not significant. Source data are provided as a Source Data file.
Immunofluorescence and Total Internal Reflection Fluorescence (TIRF) Microscopy
Purified human neutrophils (2×10⁶/ ml) were incubated on fibronectin-coated surfaces at 37°C for 1 hr in the presence of inhibitors or vehicle (DMSO), followed by stimulation with fMLP. After fixation with 4% paraformaldehyde for 5 min, cells were permeabilized with 80% acetone for 3 min and blocked with blocking buffer (10% fetal bovine serum, 5 mg/ml BSA in PBS) for 10 min. For phospho-PAK staining, cells were permeabilized with methanol. Neutrophils were stained with anti-PAK1/2/3 pThr423 (1∶100), anti-PAK2 pSer20 (1∶50), anti-Rac (1∶100), anti-active Rac-GTP (1∶100), anti-active RhoA-GTP (1∶200), anti-active Cdc42-GTP (1∶100) anti-myosin light chain2 pSer19 (1∶200), anti-vinculin (1∶100), or anti-actin (1∶100) in blocking buffer overnight at 4°C. Secondary antibodies conjugated with AlexaFluor 488 or AlexaFluor 546 (1∶500) and/or TRITC-phalloidin (1∶1000) in blocking buffer were added and incubated for 2 hr in dark. Coverslips were mounted onto glass slides and visualized with a Zeiss Axiovert fluorescent microscope. For TIRF microscopy, purified neutrophils were plated in 8-well chamber slide (Nunc) and treated with vehicle or inhibitors followed by stimulation with fMLP. Cells were fixed, permeabilized and stained for vinculin as described above. Vinculin immunofluorescence in a focal section of the neutrophil within ∼150 nm from the surface of coverslip was excited with a 488 nm-laser and detected via TIRF microscopy using a Nikon TE300 microscope equipped with a Nikon 60× oil immersion objective (NA = 1.49) and an electron multiplied CCD camera. For data presentation, fluorescent intensities of each image were adjusted based on signals detected in neutrophil samples treated without primary antibody.
Replicate samples of total neutrophil (PMN) cell lysates (50 µg per lane) were analyzed for (A) the expression of PAK1 (68 kD), PAK2 (61 kD), PAK3 (65 kD) and PAK4 (72 kD) or (D) phosphorylation of PAK1/2 Thr432/402 at indicated time points after the addition of fMLP (10 nM) by Western blot. Human neutrophils adherent on fibronectin surfaces were treated in the presence or absence of fMLP (10 nM) for 3 min and stained for (B) PAK1, PAK2 or PAK4 (green) and F-actin (red), (E) phospho-PAK2 Ser20 (green) and Rac1-GTP (red), (F) phospho-PAK2 Ser20 (green) and Cdc42-GTP (red), or (G) phospho-PAK1/2 Thr423/402 (green) and F-actin (red). In selected experiments, neutrophils were pretreated with vehicle (0.1% DMSO), EHT1864 (Rac1/2 inhibitor, 50 µM) or wortmannin (PI3K inhibitor, 100 nM). Results are quantified from at least 60 cells and presented as the mean percentage±SEM of (C) neutrophils displaying PAK immunofluorescence at actin-rich leading edge, or (H) neutrophils displaying phospho-PAK1/2 immunofluorescence in the fields of view. Representative images obtained from 3 independent experiments are shown. * P<0.05, compared to the basal level. Scale ba = 10 µm.
Confocal immunofluorescence microscopy
Cells grown in 35-mm glass bottom dishes (P35G-1.0-14-C, MatTek) were treated with EGF (20 ng ml−1) for 30 min after 16 h serum starvation or transfected with appropriate constructs or siRNA oligos and incubated for 24 h. Cells were then fixed in 2% formaldehyde at room temperature. After rinsing in PBS, cells were incubated with anti-Paxillin (rabbit at 1:100 dilution), anti-DLC1 (mouse at 1:100 dilution), anti-PTEN (rabbit at 1:100 or mouse at 1:200), anti-TNS3 (tensin-3; rabbit at 1:100 or goat at 1:50), anti-PI3K-p110 (rabbit at 1:200), anti-HA (mouse at 1:200), anti-active Rac1-GTP (mouse at 1:200) or anti-active RhoA-GTP (mouse at 1:200) antibodies for 3 h at room temperature. Samples were then incubated with the corresponding Alexa Fluor-488, -546 or -633-conjugated secondary antibodies (Invitrogen-Molecular Probes, 1:1,000) for 1 h followed by incubation with rhodamine phalloidin (Invitrogen, 1:50) or 4′,6-diamidino-2-phenylindole (Calbiochem, 1:1,000) for 30 min. Samples were visualized on a ZEISS LSM 510 META/Confocor2 microscope(Carl Zeiss MicroImaging) with pinhole set at 1 airy unit using 488, 546 and/or 633 nm excitation and a × 63/1.4 oil objective lens.
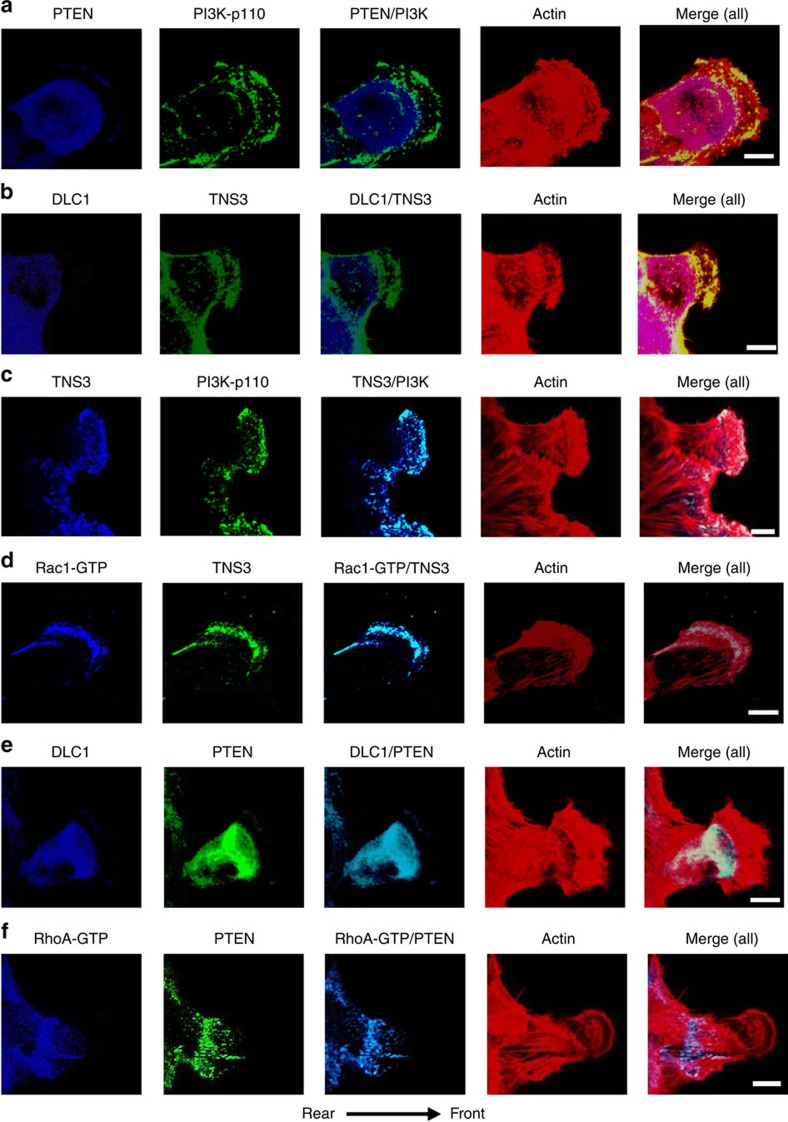
(a) Front–rear-polarized localization of PI3K and PTEN. EGF-treated MCF10A cells were co-immunostained for PTEN (blue) and PI3K-p110 (green). Actin was stained with rhodamine-phallodin (red). (b) Front–rear-polarized localization of TNS3 and DLC1 in cells under the same condition as in a. (c) TNS3 and PI3K-p110 co-localized to the leading edge of migrating cells. Cells as in a were immunostained for TNS3 (blue) and PI3K-p110 (green). (d) Rac1-GTP and TNS3 co-localized to the lamellipodial protrusion at the leading edge of a migrating cell. Cells were co-stained for Rac1-GTP (blue), TNS3 (green) and actin (red). (e) DLC1 (blue) and PTEN (green) co-localized to the posterior of a migrating cell. (f) RhoA-GTP (blue) and PTEN (green) co-localized to the posterior of a migrating cell. Images shown are representative of three independent experiments. Arrow indicates direction of migration. Scale bar, 10 μm.
Immunohistochemistry and microscopy
(a) Front–rear-polarized localization of PI3K and PTEN. EGF-treated MCF10A cells were co-immunostained for PTEN (blue) and PI3K-p110 (green). Actin was stained with rhodamine-phallodin (red). (b) Front–rear-polarized localization of TNS3 and DLC1 in cells under the same condition as in a. (c) TNS3 and PI3K-p110 co-localized to the leading edge of migrating cells. Cells as in a were immunostained for TNS3 (blue) and PI3K-p110 (green). (d) Rac1-GTP and TNS3 co-localized to the lamellipodial protrusion at the leading edge of a migrating cell. Cells were co-stained for Rac1-GTP (blue), TNS3 (green) and actin (red). (e) DLC1 (blue) and PTEN (green) co-localized to the posterior of a migrating cell. (f) RhoA-GTP (blue) and PTEN (green) co-localized to the posterior of a migrating cell. Images shown are representative of three independent experiments. Arrow indicates direction of migration. Scale bar, 10 μm.
Immunostaining and lectin staining of human tissue
Immunohistochemistry of human ARPKD samples and normal portions of tumor nephrectomy were carried out as described previously (75, 79). Briefly, 4-μm-thick paraffin sections were blocked with 3% H2O2 and 1% BSA–PBS, after deparaffinization, hydration, and antigen retrieval in 0.01 M citrate buffer (pH 6.0) at 95°C for 30 min. The sections were incubated overnight at 4°C with primary antibodies: anti-human Rac1-GTP antibody (1:100; 26903, NewEast Biosciences) or anti-cFOS antibody (1:2000; Ab190289, Abcam). After washing with PBS three times, secondary reagents (Envision+ Rabbit IgG, DAKO, or HRP-Goat anti-Mouse IgM Antibody, Invitrogen) were applied, incubated at RT for 1 hour, and visualized with ImmPACT DAB (Vector Laboratories). The sections only for Rac1-GTP were counterstained with hematoxylin. The staining was evaluated in at least 500 cystic epithelial cells. The staining of biotin-labeled Lotus tetragonolobus lectin (Biotin-LTL; 1:200; B-1325, Vector Laboratories) was performed by a similar method, but without secondary reagent and with an additional blocking for endogenous streptavidin/biotin.
75. Zhou K., Rao J., Zhou Z.-h., Yao X.-h., Wu F., Yang J., Yang L., Zhang X., Cui Y.-h., Bian X.-W., Shi Y., Ping Y.-f., RAC1-GTP promotes epithelial-mesenchymal transition and invasion of colorectal cancer by activation of STAT3. Lab. Invest. 98, 989–998 (2018). [PubMed]
79. Pearson H. B., Li J., Meniel V. S., Fennell C. M., Waring P., Montgomery K. G., Rebello R. J., Macpherson A. A., Koushyar S., Furic L., Cullinane C., Clarkson R. W., Smalley M. J., Simpson K. J., Phesse T. J., Shepherd P. R., Humbert P. O., Sansom O. J., Phillips W. A., Identification of Pik3ca mutation as a genetic driver of prostate cancer that cooperates with Pten loss to accelerate progression and castration-resistant growth. Cancer Discov. 8, 764–779 (2018). [PubMed]
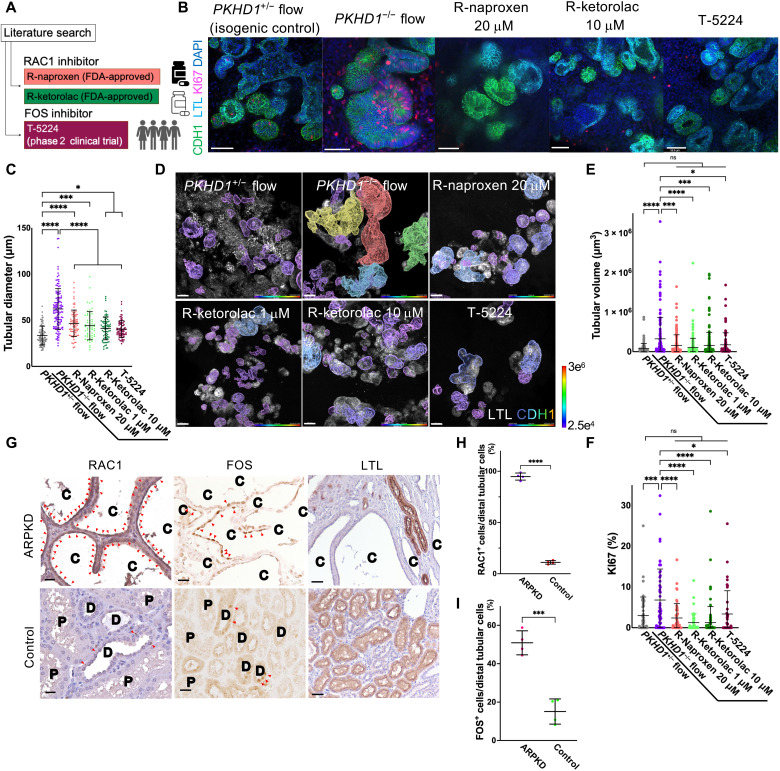
(A) Schematic of RAC1 and FOS inhibitors. (B)…… (G) Immunostaining of RAC1 (left), FOS (middle), and LTL (right) in human kidney samples from patients with ARPKD and normal portions of tumor nephrectomy (control). Arrowheads indicate RAC1-positive (left) and FOS-positive (middle) cells. C, cyst; D, distal tubule; P, proximal tubule. Scale bars, 25 μm (left and middle) and 50 μm (right). (H) Percentage of RAC1+ cells in cystic epithelial cells (ARPKD, n = 4) and distal tubular cells (control, n = 4). (I) Percentage of FOS+ cells in cystic epithelial cells (ARPKD, n = 4) and distal tubular cells (control, n = 4).
To determine whether RAC1 and FOS are activated in ARPKD patients, we immunostain for Rac1–guanosine triphosphate (Rac1-GTP; an activated form of RAC1) and FOS in kidney samples from four ARPKD patients and normal portions of tumor nephrectomy as a control. In human ARPKD samples, RAC1+ cells and FOS+ cells are 94.8 ± 3.5% and 50.9 ± 6.2%, respectively, in cystic epithelial cells, which are significantly higher than the controls with 11.1 ± 1.7% and 15.1 ± 6.6% positivity in distal tubules (Fig. 4, G to I)
Antibody staining for immunofluorescence
Embryos were fixed in 4% paraformaldehyde for 30 min at room temperature, permeabilized for 30 min in PBS with 0.4% Triton (PBST), blocked in PBST with 3% albumin (PBSTA) for 30 min and incubated with the desired primary antibody in PBSTA overnight at 4°C. The following day the embryos were washed in PBST 4 times for 10 min each, blocked with PBSTA, incubated with the appropriate secondary antibody (1:500 dilution) and DAPI overnight at 4°C. Embryos were washed again 3 times for 10 min each in PBST, deposited on glass slides and mounted in Vectashield (Vector Laboratories) medium. Images were captured using Zeiss LSM700 or LSM880 confocal microscopes.
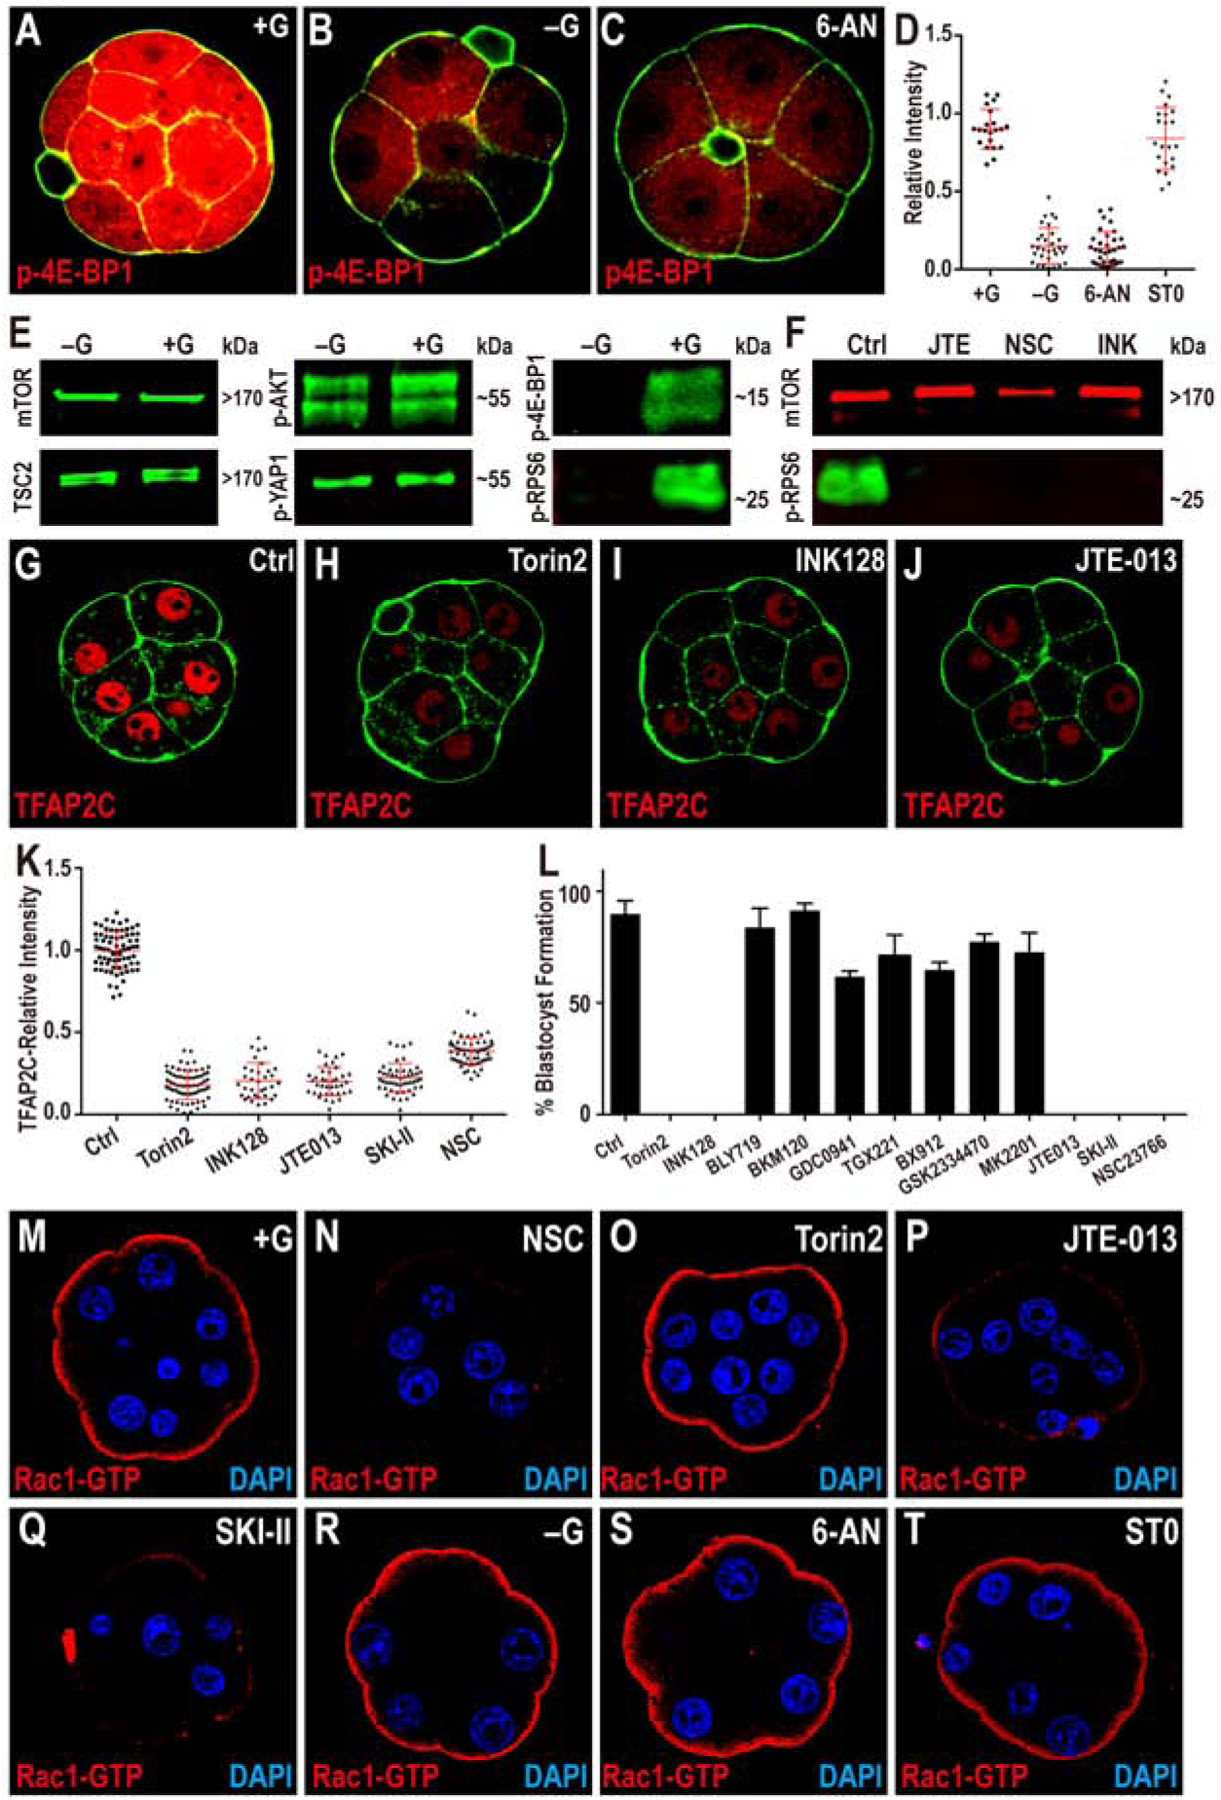
(A-D) TFAP2C translation is controlled by PPP function. Phosphorylation of threonine 37/46 on 4E-BP1 (p-4E-BP1), a target of mTOR is expressed at high levels in the 8-cell embryo (A). This expression is lost in −G (B) or when PPP is inhibited (C). Quantitation in (D) also shows that blocking HBP does not affect p-4E-BP1.
(E, F) Western blot analysis of members of mTOR signaling pathway and its activation. (E) Total mTOR, TSC2, phosphorylation level of serine 473 on AKT1/2 (p-AKT) and serine 127 on YAP1 (p-YAP1) all remain unchanged in −G embryos, but phosphorylated mTOR targets 4E-BP1 and RPS6 (p-RPS6) levels are significantly reduced. (F) p-RPS6 is eliminated when S1PR2, Rac1 or mTOR is inhibited.
(G-K) TFAP2C expression requires mTOR and S1P signaling. The expression of TFAP2C (G) is eliminated in the presence of mTOR inhibitors (H, I) and S1PR2 inhibitor JTE (J). (K) Quantitation of TFAP2C expression in embryos in which the mTOR and S1P pathways are inhibited.
(L) Quantitation shows that the morula to blastocyst transition is acutely sensitive to mTOR inhibitors, inhibitors of the S1P pathway and its downstream component Rac1, but is not affected by PI3K inhibitors.
(M-T) Role of glucose and S1P signaling in controlling Rac1 expression. In control, Rac1-GTP staining is observed only on the apical surface of the polar cells (M). Inhibition of Rac1 (N), S1P receptor (P), and S1P biosynthesis (Q) cause a significant reduction in Rac1-GTP staining. In contrast, inhibition of mTOR (O), lack of glucose during culture (R), or inhibition of specific arms of glucose metabolism (PPP and HBP) (S-T) has no effect on Rac1-GTP levels or localization.
Immunohistochemistry
Immunohistochemical staining was performed using DAKO REALTM EnVisionTM Detection System (DAKO, Santa Clara, CA) as previously described . Briefly, the FFPE specimens were cut into 4 µm-thick sections. After dewaxing, hydration, heat-induced antigen retrieval, and blocking of endogenous peroxidase activity, the sections were incubated with primary antibodies, including mouse anti-human active RAC1 (26903, 1:600, NewEast Biosciences), mouse anti-human E-cadherin (MAB-0589, Maxim, Fuzhou, China), rabbit anti-human Slug (s-1382R, Bioss, Beijing, China), and rabbit anti-human phospho-STAT3 (Tyr705) (#9145, Cell Signaling Technology) at 4 °C overnight. The sections were then incubated with secondary antibody (DK-2600, Glostrup, Denmark) at 37 °C for 30 min, and visualized using diaminobenzidine solution (DAKO) and lightly counterstained with hematoxylin. Immunohistochemical scores of RAC1-GTP, E-cadherin, and Slug were independently semi-quantified by two pathologists (YFP and JY) according to the staining intensity and percentage of positive tumor cells as previously described
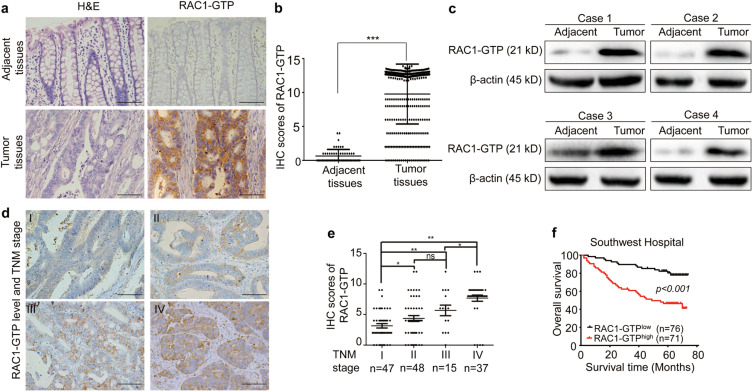
Fig. 1 Overexpression of RAC1-GTP is correlated with TNM stages of CRCs and predicts poor prognosis of CRC patients.
a Representative images of H&E staining and IHC staining of RAC1-GTP in CRC tumor tissues and adjacent normal tissues. Scale bar = 100 μm. bH-scored quantification of IHC staining for RAC1-GTP. c Western blot analysis of RAC1-GTP in tumor and adjacent normal tissues. d Representative IHC staining of RAC1-GTP in CRC samples at different TNM stages. Scale bar = 100 μm. e IHC scores of RAC1-GTP expression in the tumors of all stages. f Kaplan–Meier analysis of the correlation between RAC1-GTP and overall survival in 147 CRC patients. *p < 0.05; **p < 0.01; ***p < 0.001; ns not significant
Immunohistochemical analysis
The Pathological Center of Ningbo City provided paraffin sections of five pairs of LIHC tissue specimens and adjacent tissue specimens from postoperative patients with LIHC from Department of Radiation Oncology, The Affiliated Lihuili Hospital, Ningbo University between January 2021 to December 2021. RAC1-GTP antibody was purchased from NewEast Biosciences (cat no. 26903; RRID: AB_1961793; NewEast Biosciences, Wuhan, Zhejiang). The study was conducted in accordance with the Declaration of Helsinki (as revised in 2013). The Ethics Committee of The Affiliated Lihuili Hospital, Ningbo University approved this study (No. KY2022SL322-01). Individual consent for this retrospective analysis was waived. Determine the proportion of positive cells based on sample color and staining intensity, and evaluate the expression intensity of cells. If 0–10% is negative, the score is 0; 11–30% are weakly positive, with a score of 1; 31–60% is positive, with a score of 2; 61–100% are strongly positive, with a score of 3.
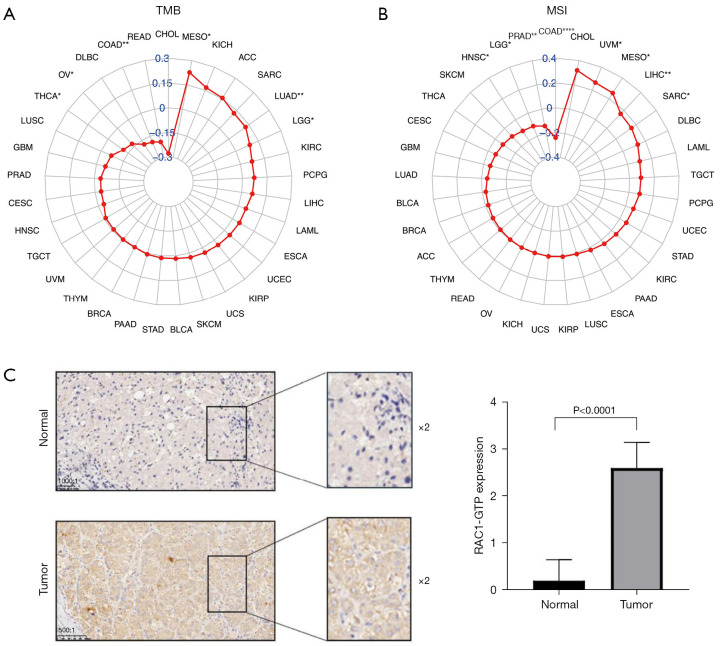
The relationship between RAC1 expression and tumor mutational burden and microsatellite instability, and the expression of RAC1-GTP in LIHC and adjacent normal tissues. Expression of RAC1 correlated with tumor mutational burden (A) and microsatellite instability (B) in 33 cancers by Pearson’s correlation analysis. (C) Immunohistochemical analysis of RAC1-GTP expression in patients with LIHC (scale bar, 1,000:1; 500:1). The red color refers to Pearson correlation coefficient “r”. *, P<0.05; **, P<0.01; ****, P<0.0001. TMB, tumor mutational burden; MSI, microsatellite instability; CHOL, cholangiocarcinoma; MESO, mesothelioma; KICH, kidney chromophobe; ACC, adrenocortical carcinoma; SARC, sarcoma; LUAD, lung adenocarcinoma; LGG, lower grade glioma; KIRC, kidney renal clear cell carcinoma; PCPG, pheochromocytoma and paraganglioma; LIHC, liver hepatocellular carcinoma; LAML, acute myeloid leukemia; ESCA, esophageal carcinoma; UCEC, uterine corpus endometrial carcinoma; KIRP, kidney renal papillary cell carcinoma; UCS, uterine carcinosarcoma; SKCM, skin cutaneous melanoma; BLCA, bladder urothelial carcinoma; STAD, stomach adenocarcinoma; PAAD, pancreatic adenocarcinoma; BRCA, breast invasive carcinoma; THYM, thymoma; UVM, uveal melanoma; TGCT, testicular germ cell tumors; HNSC, head and neck squamous cell carcinoma; CESC, cervical squamous cell carcinoma and endocervical adenocarcinoma; PRAD, prostate adenocarcinoma; GBM, glioblastoma multiforme; LUSC, lung squamous cell carcinoma; THCA, thyroid carcinoma; OV, ovarian serous cystadenocarcinoma; DLBC, lymphoid neoplasm diffuse large B-cell lymphoma; COAD, colon adenocarcinoma; READ, rectum adenocarcinoma; RAC1, Ras-related C3 botulinum toxin substrate 1; GTP, guanosine triphosphate; LIHC, liver hepatocellular carcinoma.
Rac1 Activation Assay
Rac1 activity was measured by an affinity precipitation assay with Pak1 PBD agarose beads53. BMDMs were lysed in 500 μl lysis buffer (20 mM HEPES, pH 7.4, 150 mM NaCl, 1% Triton X-100, 4 mM EDTA, 4 mM EGTA, 10% glycerol, supplemented with protease inhibitor cocktail [Roche]). Ten percent of the whole cell lysate was set-aside for Rac1 loading control. To the remainder of the sample, 10 μg of Pak1 PBD beads were added, followed by a 45-minute incubation at 4°C. Beads were washed with lysis buffer and subsequently brought up in Laemmli sample buffer. Activated (GTP-bound) Rac1 was detected by immunoblot after affinity precipitation, and whole cell lysates were used as loading controls.
For active Rac1 immunofluorescence staining, human monocyctes or BMDMs were adhered, fixed and permeabilized, followed by primary staining with mouse anti-activated Rac1 (New East Biosciences) and secondary staining with Alexa Fluor 488 Goat Anti-Mouse IgM (Invitrogen). Corrected total cell fluorescence was quantified by ImageJ45. Each individual data point represents an average CTCF of 4 fields of view with at least 20 cells per field of view.
Histology and Microscopy
Animals were euthanized, and tissue was perfusion fixed with 4% paraformaldehyde. Aortas harvested and fixed for 12 hours with paraformaldehyde (4%, buffered neutral) overnight at 4°C. Aortas were then cleaned under dissection microscope. Traditional hematoxylin and eosin (H&E), Masson’s trichrome, and Alizarin red staining protocols were performed on 10-μm thick cross sections at the level of the aortic sinus, between 1400-1700 μm from the most inferior section of the valve tissue facing the left ventricular outflow tract. Quantifications of plaque area, plaque collagen area, and calcium area were carried out using ImageJ45. Each individual data point represents the average quantification from 3 aortic valve sinuses taken from the 6-8 adjacent sections per slide of on aortic sinus. Some ascending aortas (1-2 mm) at the level of the arch inferior to the brachiocephalic branch were fixed for 12 hours with paraformaldehyde (4%, buffered neutral) overnight at 4°C. Aortas were then cleaned under dissection microscope, placed in 30% Sucrose for up to 1 week, and embedded in Optimal Cutting Temperature (OCT) compound in pre-labeled Cryomold squares (Tissue-Tek®) followed by dry ice for 10-15 minutes. Tissue was sectioned at 10 μm thickness by cryostat. After sectioning, slides were dried at room temperature for 1-2 hours before immunostaining.
Sections (10 μm thickness) were immunostained Cy3-conjugated anti-α-smooth muscle actin (Sigma-Aldrich, Cat#C6198), anti-alkaline phosphatase (Abcam, Cat#Ab65834), anti-RUNX2 (Abcam, Cat#Ab76956), rat anti-mouse CD68 (BioLegend #137002), or mouse anti-activated Rac1 (New East Biosciences, Cat#26903). Unconjugated primary antibody staining was visualized with Goat Anti-Rat IgG H&L Cy5 (Abcam, Cat#Ab6565) and Goat Anti-Mouse IgG, IgM (H+L) AlexaFluor488 (Invitrogen, Cat#A10680). All sections were counterstained with DAPI. Bright field and immunofluorescence microscopy of sectioned tissue were carried out on a Nikon Eclipse 80i inverted microscope. Images were taken with Nikon Plan Apochromat 2X (numerical aperture 0.1), 4X (numerical aperture 0.2), 10x (numerical aperture 0.3), 20x (numerical aperture 0.75) objective lenses. Quantifications of percent area positive activated Rac1 staining, RUNX2 staining, or ALP staining per plaque were carried out using ImageJ45. Each individual data point represents the average quantification of each animal using the average area of images captured from 4-6 adjacent sections per slide.
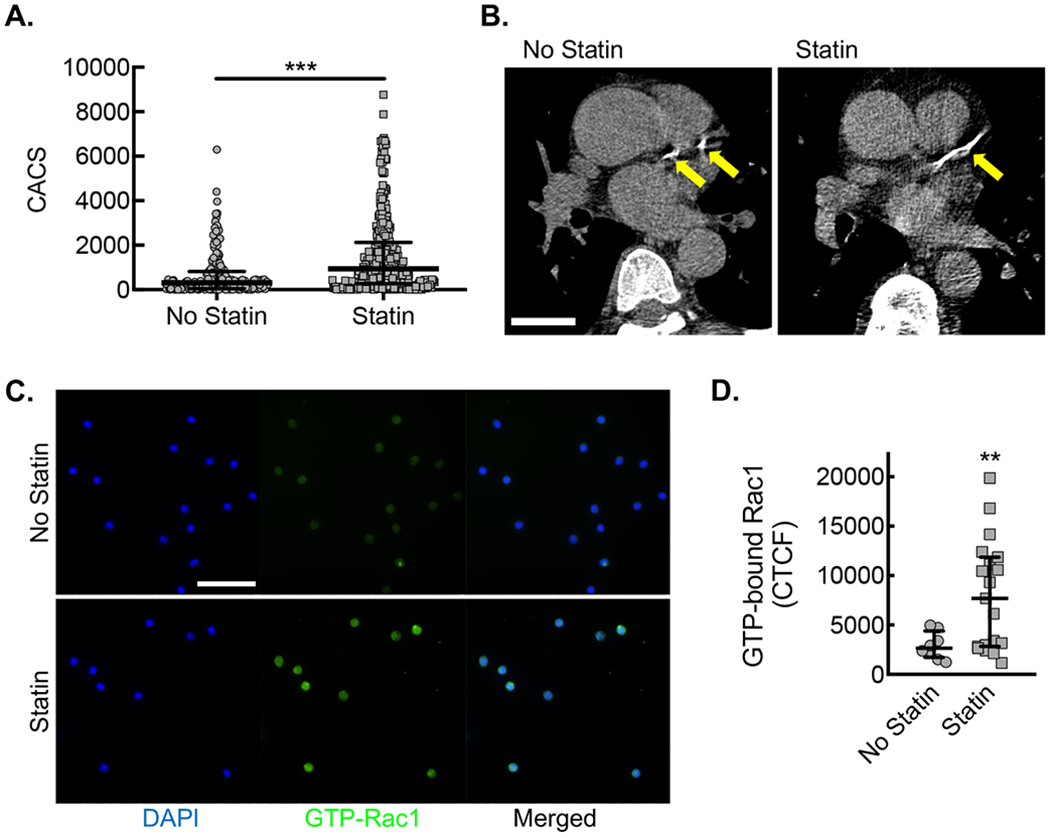
(A) CACS for each patient along with median and interquartile ranges for patients not taking statin (No statin, gray circles) vs. patients taking statin (Statin, gray squares) (***, P=0.0001 Mann-Whitney U; n=182 no statin and n=283 statin). (B) Example of differences in coronary calcium from patients of similar age not taking (No statin) or taking statin (Statin), using LCSCT axial images at the level of proximal left anterior descending coronary artery (LAD, yellow arrows) with total CACS of 283 and 412, respectively. Bar, 3 cm. (C) Immunofluorescent micrographs from CD14+ CD16− monocytes isolated from patients not taking statin (No statin, gray circles) vs. patients taking statin (Statin, gray squares) stained with antibody specific to activated Rac1 (green). Counterstaining with DAPI (blue). Bar, 50 μm. Quantification of Corrected Total Cell Fluorescence (CTCF) for activated Rac1 (**, P=0.029 Mann-Whitney U; No statin, n=8 patients; Statin, n=16 patients).
Histology and Microscopy
Animals were euthanized, and tissue was perfusion fixed with 4% paraformaldehyde. Aortas harvested and fixed for 12 hours with paraformaldehyde (4%, buffered neutral) overnight at 4°C. Aortas were then cleaned under dissection microscope. Traditional hematoxylin and eosin (H&E), Masson’s trichrome, and Alizarin red staining protocols were performed on 10-μm thick cross sections at the level of the aortic sinus, between 1400-1700 μm from the most inferior section of the valve tissue facing the left ventricular outflow tract. Quantifications of plaque area, plaque collagen area, and calcium area were carried out using ImageJ45. Each individual data point represents the average quantification from 3 aortic valve sinuses taken from the 6-8 adjacent sections per slide of on aortic sinus. Some ascending aortas (1-2 mm) at the level of the arch inferior to the brachiocephalic branch were fixed for 12 hours with paraformaldehyde (4%, buffered neutral) overnight at 4°C. Aortas were then cleaned under dissection microscope, placed in 30% Sucrose for up to 1 week, and embedded in Optimal Cutting Temperature (OCT) compound in pre-labeled Cryomold squares (Tissue-Tek®) followed by dry ice for 10-15 minutes. Tissue was sectioned at 10 μm thickness by cryostat. After sectioning, slides were dried at room temperature for 1-2 hours before immunostaining.
Sections (10 μm thickness) were immunostained Cy3-conjugated anti-α-smooth muscle actin (Sigma-Aldrich, Cat#C6198), anti-alkaline phosphatase (Abcam, Cat#Ab65834), anti-RUNX2 (Abcam, Cat#Ab76956), rat anti-mouse CD68 (BioLegend #137002), or mouse anti-activated Rac1 (New East Biosciences, Cat#26903). Unconjugated primary antibody staining was visualized with Goat Anti-Rat IgG H&L Cy5 (Abcam, Cat#Ab6565) and Goat Anti-Mouse IgG, IgM (H+L) AlexaFluor488 (Invitrogen, Cat#A10680). All sections were counterstained with DAPI. Bright field and immunofluorescence microscopy of sectioned tissue were carried out on a Nikon Eclipse 80i inverted microscope. Images were taken with Nikon Plan Apochromat 2X (numerical aperture 0.1), 4X (numerical aperture 0.2), 10x (numerical aperture 0.3), 20x (numerical aperture 0.75) objective lenses. Quantifications of percent area positive activated Rac1 staining, RUNX2 staining, or ALP staining per plaque were carried out using ImageJ45. Each individual data point represents the average quantification of each animal using the average area of images captured from 4-6 adjacent sections per slide.
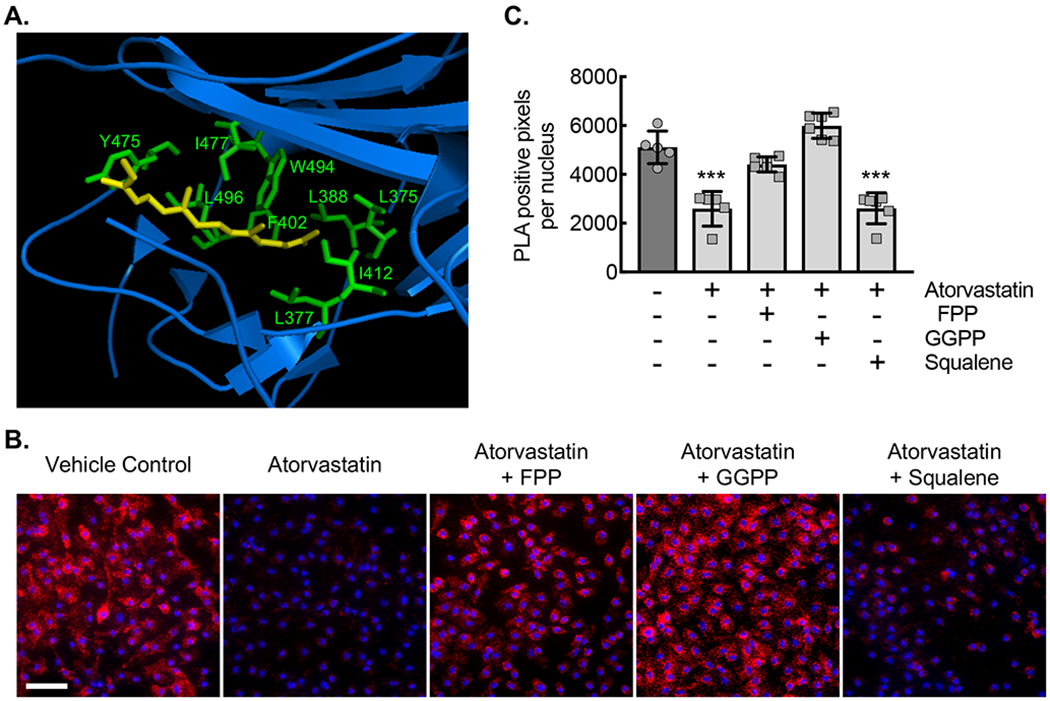
(A) Ribbon diagram modeling the interaction between GDP-bound (inactive) Rac1 and Rho-GDI. Yellow arrow denotes the isoprenyl group sitting in a hydrophobic pocket. Hydrophobic amino acids labeled in green. (B) Micrographs of ApoE−/− BMDMs incubated with vehicle control (DMSO) or with atorvastatin (10 μM) without or with either FPP (5 μM), GGPP (5 μM), or squalene (5 μM) for 24 hours, followed by proximity ligation assay to detect the Rho-GDI-Rac1 complex (red signal). Counterstaining with DAPI (blue). Bar, 50 μm. (C) Quantification of PLA signal from conditions in panel C (***, P<0.0001 ANOVA; n=6 biological replicates from 3 mice). Quantitative data are displayed as mean ± SD.
Histology and Microscopy
Animals were euthanized, and tissue was perfusion fixed with 4% paraformaldehyde. Aortas harvested and fixed for 12 hours with paraformaldehyde (4%, buffered neutral) overnight at 4°C. Aortas were then cleaned under dissection microscope. Traditional hematoxylin and eosin (H&E), Masson’s trichrome, and Alizarin red staining protocols were performed on 10-μm thick cross sections at the level of the aortic sinus, between 1400-1700 μm from the most inferior section of the valve tissue facing the left ventricular outflow tract. Quantifications of plaque area, plaque collagen area, and calcium area were carried out using ImageJ45. Each individual data point represents the average quantification from 3 aortic valve sinuses taken from the 6-8 adjacent sections per slide of on aortic sinus. Some ascending aortas (1-2 mm) at the level of the arch inferior to the brachiocephalic branch were fixed for 12 hours with paraformaldehyde (4%, buffered neutral) overnight at 4°C. Aortas were then cleaned under dissection microscope, placed in 30% Sucrose for up to 1 week, and embedded in Optimal Cutting Temperature (OCT) compound in pre-labeled Cryomold squares (Tissue-Tek®) followed by dry ice for 10-15 minutes. Tissue was sectioned at 10 μm thickness by cryostat. After sectioning, slides were dried at room temperature for 1-2 hours before immunostaining.
Sections (10 μm thickness) were immunostained Cy3-conjugated anti-α-smooth muscle actin (Sigma-Aldrich, Cat#C6198), anti-alkaline phosphatase (Abcam, Cat#Ab65834), anti-RUNX2 (Abcam, Cat#Ab76956), rat anti-mouse CD68 (BioLegend #137002), or mouse anti-activated Rac1 (New East Biosciences, Cat#26903). Unconjugated primary antibody staining was visualized with Goat Anti-Rat IgG H&L Cy5 (Abcam, Cat#Ab6565) and Goat Anti-Mouse IgG, IgM (H+L) AlexaFluor488 (Invitrogen, Cat#A10680). All sections were counterstained with DAPI. Bright field and immunofluorescence microscopy of sectioned tissue were carried out on a Nikon Eclipse 80i inverted microscope. Images were taken with Nikon Plan Apochromat 2X (numerical aperture 0.1), 4X (numerical aperture 0.2), 10x (numerical aperture 0.3), 20x (numerical aperture 0.75) objective lenses. Quantifications of percent area positive activated Rac1 staining, RUNX2 staining, or ALP staining per plaque were carried out using ImageJ45. Each individual data point represents the average quantification of each animal using the average area of images captured from 4-6 adjacent sections per slide.
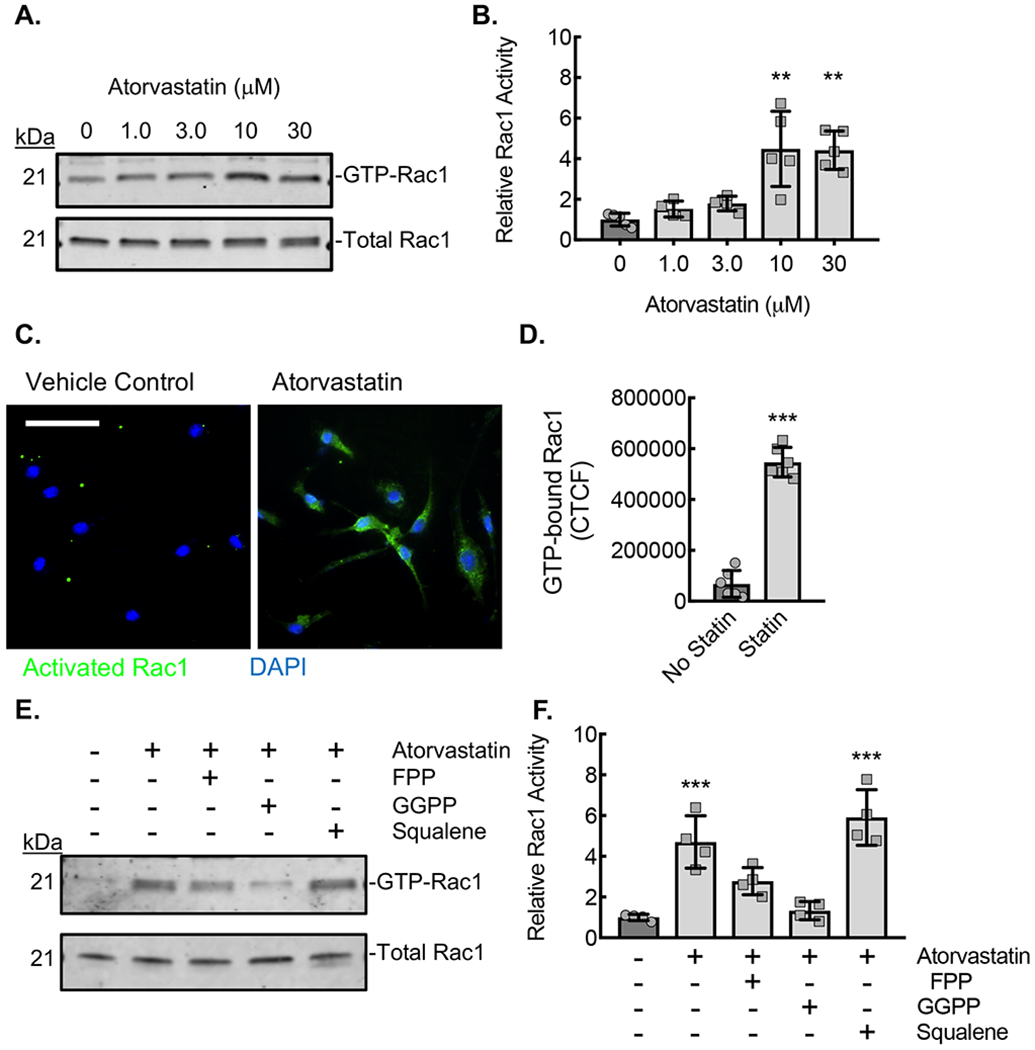
(A) Rac1 immunoblots from lysates of ApoE−/− BMDMs incubated with the indicated concentrations of atorvastatin for 24 hours, after which active (GTP-bound) Rac1 was affinity precipitated by PBD pulldown assay. (B) Densitometry quantification of the relative activated (GTP-bound) Rac1 to total Rac1 in lysates from panel A (**, P<0.0002; n=5 biological replicates from 5 mice; 3 male and 2 female). (C) Micrographs from BMDMs treated with atorvastatin (10 μM) and stained with antibody specific to activated (GTP-bound) Rac1 (green). Counterstaining with DAPI (blue). Bar, 50 μm. (D) Quantification of the Corrected Total Cell Fluorescence (CTCF) for active Rac1from conditions in panel C (***, P<0.0001 t-test; n=6 biological replicates from 3 mice; 2 male and 1 female). (E) Rac1 immunoblots from lysates of ApoE−/− BMDMs incubated with vehicle control (DMSO) or atorvastatin (10 μM) without or with either FPP (5 μM), GGPP (5 μM), or squalene (5 μM) for 24 hours, after which GTP-bound Rac1 was affinity precipitated by PBD pulldown. (F) Densitometry quantification of the relative active (GTP-bound) Rac1 to total Rac1 in lysates from panel E (**, P<0.0001; n=4 biological replicates from 4 mice; 2 male and 2 female). Quantitative data are displayed as mean ± SD.
Histology and Microscopy
Animals were euthanized, and tissue was perfusion fixed with 4% paraformaldehyde. Aortas harvested and fixed for 12 hours with paraformaldehyde (4%, buffered neutral) overnight at 4°C. Aortas were then cleaned under dissection microscope. Traditional hematoxylin and eosin (H&E), Masson’s trichrome, and Alizarin red staining protocols were performed on 10-μm thick cross sections at the level of the aortic sinus, between 1400-1700 μm from the most inferior section of the valve tissue facing the left ventricular outflow tract. Quantifications of plaque area, plaque collagen area, and calcium area were carried out using ImageJ45. Each individual data point represents the average quantification from 3 aortic valve sinuses taken from the 6-8 adjacent sections per slide of on aortic sinus. Some ascending aortas (1-2 mm) at the level of the arch inferior to the brachiocephalic branch were fixed for 12 hours with paraformaldehyde (4%, buffered neutral) overnight at 4°C. Aortas were then cleaned under dissection microscope, placed in 30% Sucrose for up to 1 week, and embedded in Optimal Cutting Temperature (OCT) compound in pre-labeled Cryomold squares (Tissue-Tek®) followed by dry ice for 10-15 minutes. Tissue was sectioned at 10 μm thickness by cryostat. After sectioning, slides were dried at room temperature for 1-2 hours before immunostaining.
Sections (10 μm thickness) were immunostained Cy3-conjugated anti-α-smooth muscle actin (Sigma-Aldrich, Cat#C6198), anti-alkaline phosphatase (Abcam, Cat#Ab65834), anti-RUNX2 (Abcam, Cat#Ab76956), rat anti-mouse CD68 (BioLegend #137002), or mouse anti-activated Rac1 (New East Biosciences, Cat#26903). Unconjugated primary antibody staining was visualized with Goat Anti-Rat IgG H&L Cy5 (Abcam, Cat#Ab6565) and Goat Anti-Mouse IgG, IgM (H+L) AlexaFluor488 (Invitrogen, Cat#A10680). All sections were counterstained with DAPI. Bright field and immunofluorescence microscopy of sectioned tissue were carried out on a Nikon Eclipse 80i inverted microscope. Images were taken with Nikon Plan Apochromat 2X (numerical aperture 0.1), 4X (numerical aperture 0.2), 10x (numerical aperture 0.3), 20x (numerical aperture 0.75) objective lenses. Quantifications of percent area positive activated Rac1 staining, RUNX2 staining, or ALP staining per plaque were carried out using ImageJ45. Each individual data point represents the average quantification of each animal using the average area of images captured from 4-6 adjacent sections per slide.
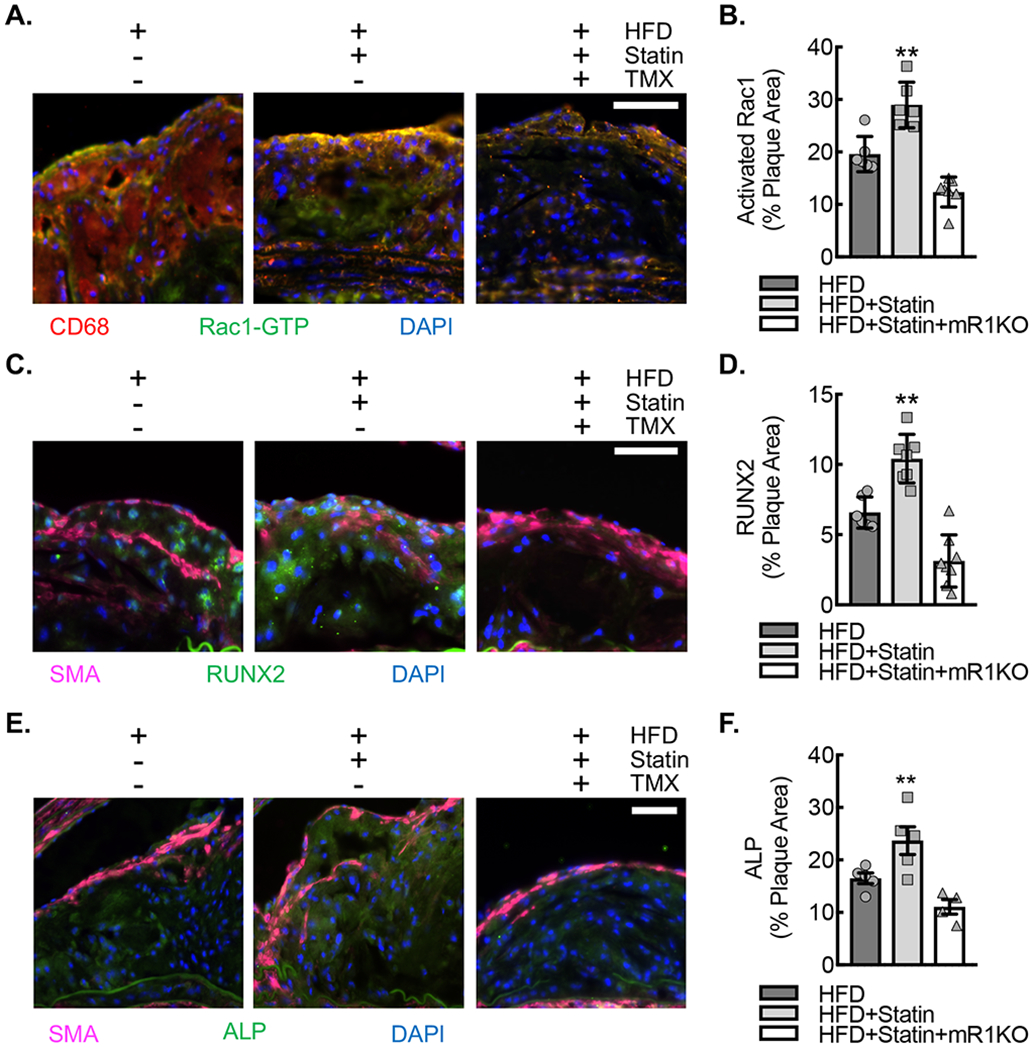
(A) Immunofluorescence micrographs of neointimal lesions in the ascending aortic arch lesser curvature of ApoE−/−CSF1RmcmRac1fl/fl mice fed HFD, HFD+Statin or HFD+Statin+mR1KO for 18 weeks that were stained for GTP-bound (activated) Rac1 (green) and CD68 (red). Nuclei counterstained with DAPI (blue). Bar, 50 μm. (B) Quantification of percent plaque area staining positive for activated Rac1 expression in aortic arch plaques from A (**, P<0.005 relative to others by ANOVA; n=6 animals; 3 male and 3 female). (C) Immunofluorescence micrographs of neointimal lesions derived as described in (A) that were stained for ALP (green) and SMA (magenta). Nuclei counterstained with DAPI (blue). Bar, 50 μm. (D) Quantification percent plaque area staining positive for ALP expression (*, P<0.05 relative to others by ANOVA; n=6 ; 3 male and 3 female). (E) Immunofluorescence micrographs of neointimal lesions derived as described in (A) that were stained for RUNX2 (green) and SMA (magenta). Nuclei counterstained with DAPI (blue). Bar, 50 μm. (F) Quantification percent plaque area staining positive for RUNX2 expression (**, P
Immunofluorescence
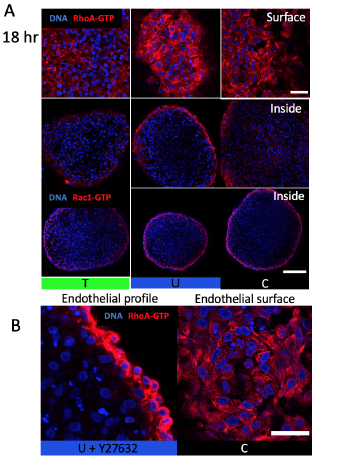
Cushions were fixed in 4% PFA for 30 min at 4°C, permeabilized with 0.02% Triton-X and blocked using 3% BSA, 20 mM MgCl, 0.3% Tween 20, 0.3 M glycine, and 5% donkey serum in 1×TBS. Samples were incubated with the following primary antibodies at 1:100 dilution unless noted otherwise: PHH3 (mouse or rat, 9701), caspase 3 (mouse, Cell Signaling, 9662), alpha-smooth-muscleactin-Cy3 conjugated (mouse, Sigma, C6198), RhoA-GTP (mouse, New East Biosciences, 26904), Rac1-GTP (mouse, New East Biosciences, 26903), erk12pERK (rabbit, 3192), pSmad2/3 (rabbit, Cell Signaling, 9701), pSmad1/5 (Cell Signaling, 9516), pSER19 on myosin light chain kinase (rabbit, 1:50, Thermo-Scientific, PA5-17726) and VE-cadherin (rabbit, Abcam ab33168). Antibodies requiring amplification (pERK, pSmad1/5 and pSmad2/3) were also incubated in 1% H2O2 in PBS for 40 min, stained using HRP-conjugated secondary antibodies and incubated using a TSA kit. Secondary antibodies were applied in 5% BSA in TBS at 1:100 unless noted: goat anti-mouse Alexa Fluor 488 (Thermo, A-21202), goat anti-rabbit Alexa Fluor 568 Thermo, A11011 (1:200 for VE-cad), goat anti-mouse Alexa Fluor 635 Thermo, A31574 and donkey anti-mouse Alexa Fluor 647 A-31571. After staining, cushions were optically cleared using HISTO-M solution (Visikol). Stained cushions were imaged in glass-bottomed 96-well plates using an inverted Zeiss LSM 710 microscope. For LAL sections, whole hearts from day 7 chicks were flushed with TBS and fixed with 4% PFA overnight, embedded with paraffin wax and sectioned. Antigen retrieval was carried out with citrate buffer. Endogenous peroxidase was blocked with 1% H2O2 in PBS for 40 min. Sections were then permeabilized and blocked with the buffer as above. Sections were incubated with pSmad1/5 (rabbit, 1:100, Cell Signaling, 9516) or pERK12 (rabbit, 1:100, Cell Signaling, 3192) and with MF20 (mouse, 1:100, 14-6503-82). Sections were then incubated with donkey anti-rabbit HRP (1:100, 611-703-127) and donkey anti-mouse AF568 (1:100, Thermo-Scientific, A10037). Signal was amplified using TSA Amplification Kit (Perkin Elmer).
Figure S3. Osmotic stress affects endothelial RhoA-GTP patterning not activity. (A) RhoA-GTP localization on cushion surface and 30 microns inside and Rac1-GTP inside (B) Disruption of apical-basal polarity at endothelium with ROCK inhibition (C) Honeycomb like pattern in RhoA-GTP stain associated with compressive stress
2.4. Immunofluorescence microscopy
In all immunofluorescence studies, cells were fixed in 4% paraformaldehyde for 10 min, permeabilized in 0.25% Triton X-100 for 5 min, blocked in 10% FBS, and immunostained overnight with anti-Rac1 (1:100), anti-Tiam1 (1:100), anti-EEA1 (1:100) or anti-IQGAP (1:100) antibodies. Following incubation with Alexafluor-488 or -555 labeled secondary antibodies (1:250 dilution) and DAPI staining, cells were imaged using an Olympus IX81 inverted epifluorescence microscope.
2.5. Leading edge immunofluorescence microscopy
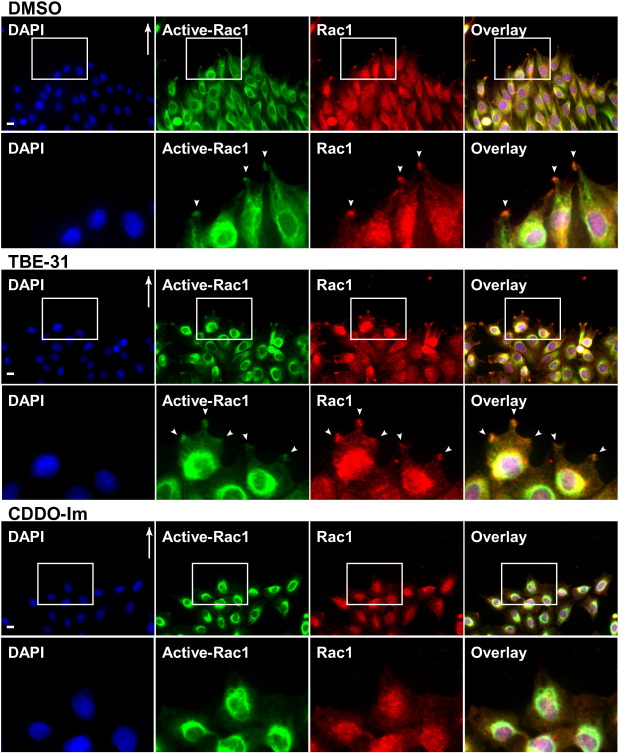
For immunofluorescence studies examining proteins at the leading edge, Rat2 fibroblasts were grown to confluence on glass coverslips, and scratched with a pipette tip. They were then allowed to elongate and polarize for 4 h, before incubating in media containing DMSO, 1.0 μM of TBE-31, or 1.0 μM of CDDO-Im for 2 h. The cells were then fixed, permeabilized and immunostained with the primary and secondary antibodies as described above. For experiments where cells were probed using TBE-56 (or the TBE-55 control), the cells were left untreated before being fixed, permeabilized and immunostained with the appropriate primary antibodies.
Fig. 3. Confluent monolayers of Rat2 fibroblasts were scratched and incubated at 37 °C in DMEM supplemented with 10% FBS for 4 h to allow them to polarize. Cells were then incubated for 2 h in media containing 0.1% DMSO, 1 M TBE-31, or 1 M CDDO-Im. The cells were then fixed, permeabilized and immunostained with an antibody that recognizes GTP-bound Rac1 (Active-Rac1; green), a Rac1 antibody (Rac1; red) and DAPI (blue) for the nuclei. Shown are representative immunofluorescence images. Areas of interest (insets) are magnified and are shown below each panel. Bar = 10 m.
Immunofluorescence
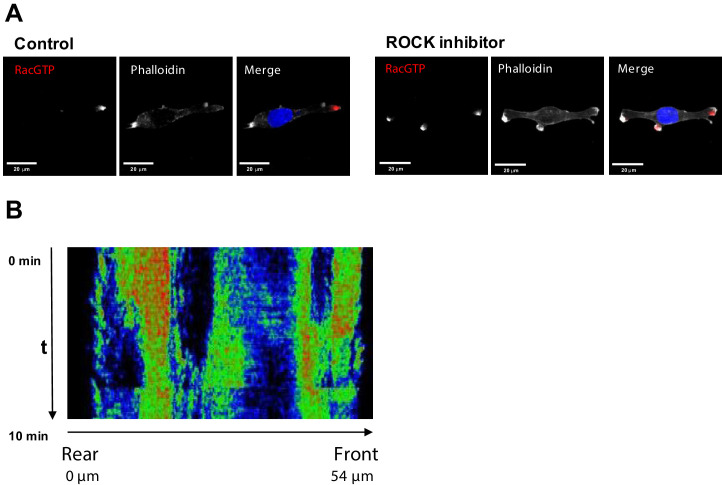
Cells were seeded onto high performance glass coverslip, thickness 1 1/2 (Zeiss, cat.474030-9000-000) coated with 0.01% collagen. For ROCK inhibition cells were pretreated as indicated in the corresponding section with Y-27632. Cells were washed twice with PBS, fixed and permeabilized with 3.7% formaldehyde, 0.025% NP-40 in 50 mM Pipes pH6.8, 10 mM MgCl2 for 5 min and blocked in TBS (50 mM Tris, pH 7.5, 150 mM NaCl) containing 2% BSA for 1 hr. Coverslips were incubated overnight in TBS containing 1% BSA with primary anti-Rac1-GTP (New East Bio cat.26903) (1:100), anti-ROCK1 (Thermo cat.PA5-22262) (1:100) or anti-DIA1 (1:200) antibodies. Slides were washed twice with TBS and then incubated for 1 hr at room temperature with secondary antibodies anti-mouse F(ab’)2 Fragment Alexa Fluor 647 Conjugate (Thermo cat. A-21237), Donkey anti-rabbit Alexa fluor-488 (Cat. A-21206) or anti-rabbit Alexa fluor-594 (Thermo cat. A-11012) for confocal; anti-rabbit F(ab’)2 Fragment Alexa Fluor 594 Conjugate (Thermo cat. A-11072) and anti-mouse F(ab’)2 Fragment Alexa Fluor 647 Conjugate for super-resolution microscopy. Slides were washed twice with TBS and incubated with DAPI, 1:100, and phalloidin, conjugated with rhodamine or Alexa Fluor-488 (1:100) (Thermo A12379) for 5 min, washed two times and mounted using VECTASHIELD antifade mounting media (Vector labs Cat. H-1000). Confocal images were taken with an Olympus FV100 or a Nikon A1+ confocal, with 60x oil objective. Super-resolution images were taken with a N-SIM microscope using a with 100x oil objective.
(A) Fluorescent microscopy images of Rac1 activity (red), and F-actin (phalloidin, white) and nuclear (DAPI, blue) staining in fixed MDA-MB-213 cells treated or not with 2.5 µM Y-27632 ROCK inhibitor for 15 min. (B) Spatiotemporal pattern of the RhoA activity in cells treated with 2.5 µM of ROCK inhibitor Y-27632 measured by the RhoA FRET probe.
Immunofluorescence
Cells were seeded onto high performance glass coverslip, thickness 1 1/2 (Zeiss, cat.474030-9000-000) coated with 0.01% collagen. For ROCK inhibition cells were pretreated as indicated in the corresponding section with Y-27632. Cells were washed twice with PBS, fixed and permeabilized with 3.7% formaldehyde, 0.025% NP-40 in 50 mM Pipes pH6.8, 10 mM MgCl2 for 5 min and blocked in TBS (50 mM Tris, pH 7.5, 150 mM NaCl) containing 2% BSA for 1 hr. Coverslips were incubated overnight in TBS containing 1% BSA with primary anti-Rac1-GTP (New East Bio cat.26903) (1:100), anti-ROCK1 (Thermo cat.PA5-22262) (1:100) or anti-DIA1 (1:200) antibodies. Slides were washed twice with TBS and then incubated for 1 hr at room temperature with secondary antibodies anti-mouse F(ab’)2 Fragment Alexa Fluor 647 Conjugate (Thermo cat. A-21237), Donkey anti-rabbit Alexa fluor-488 (Cat. A-21206) or anti-rabbit Alexa fluor-594 (Thermo cat. A-11012) for confocal; anti-rabbit F(ab’)2 Fragment Alexa Fluor 594 Conjugate (Thermo cat. A-11072) and anti-mouse F(ab’)2 Fragment Alexa Fluor 647 Conjugate for super-resolution microscopy. Slides were washed twice with TBS and incubated with DAPI, 1:100, and phalloidin, conjugated with rhodamine or Alexa Fluor-488 (1:100) (Thermo A12379) for 5 min, washed two times and mounted using VECTASHIELD antifade mounting media (Vector labs Cat. H-1000). Confocal images were taken with an Olympus FV100 or a Nikon A1+ confocal, with 60x oil objective. Super-resolution images were taken with a N-SIM microscope using a with 100x oil objective.
Inhibition of ROCK leads to the formation of multi-polar cells.
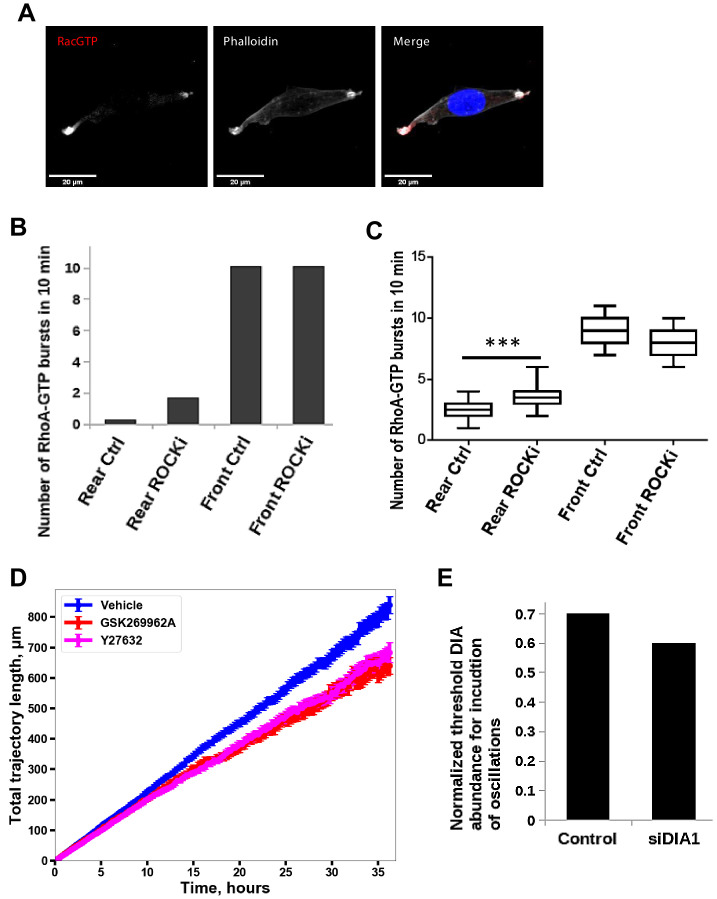
(A) A different biological replicate of fluorescent microscopy image of Rac1 activity (red), and F-actin (phalloidin, white) and nuclear (DAPI, blue) staining in fixed MDA-MB-213 cells treated with 2.5 µM Y-27632 ROCK inhibitor for 15 min. (B) Model-predicted numbers of RhoA activity bursts during 10 min at the leading edge and the rear for control cells and cells where ROCK was inhibited by 2.5 μM of Y-27632. (C) The number of experimentally observed RhoA activity bursts during 10 min measured using the RhoA FRET probe at the leading edge and the rear for control cells and cells treated with the ROCK inhibitor Y-27632. Error bars represent 1st and 3rd quartiles, asterisks *** indicate p<0.001 calculated using unpaired t-test. (D) Quantification of the total distance travelled by the control cells and cells treated with a ROCK inhibitor. Results were similar for two different ROCK inhibitors, 10 μM Y-27632 and 1 μM GSK269962A. (E) Model predicted lower threshold of DIA abundance for induction of RhoA-Rac1 oscillations (region 1 in Figure 2A) in control and DIA knockdown conditions.
.
Immunofluorescence microscopy and FRAP assays
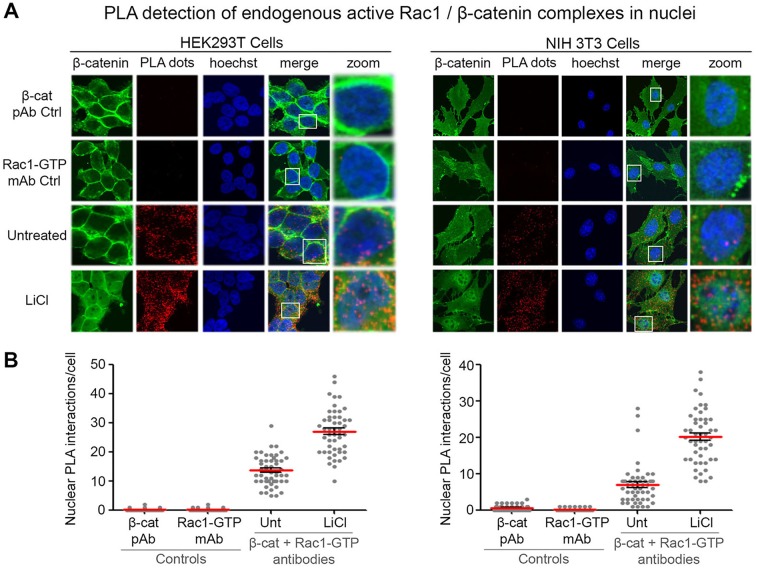
Cells were washed three times with phosphate-buffered saline (PBS), fixed with 3.7% Formalin-PBS (F1635, Sigma-Aldrich) then permeabilized with 0.2% Triton-X-100-PBS (0694, Amresco, USA) for 10 min, blocked with 3% BSA-PBS (A7906, Sigma-Aldrich) and incubated with primary antibodies for 1 h at room temperature. Cells were washed twice with PBS before secondary antibodies were added for 40 min. Cells were subsequently mounted with Vectashield (Vector Laboratories, USA) and visualized by fluorescence microscopy and imaged and scored using an Olympus FV1000 confocal laser microscope. Fluorescence recovery after photobleaching (FRAP) assay to measure nuclear import rates of β-catenin-GFP in live NIH3T3 cells was as described previously (Jamieson et al., 2011), using an Olympus FV1000 confocal laser microscope. Briefly, three pre-bleach images of the cell were acquired, then the nucleus was bleached (60–70 frames). Post-bleach imaging was in two stages: 30 frames at the fastest interval, then 30 frames at 10 s intervals. Fluorescence intensities for cytoplasm, nucleus and background were acquired using Olympus Fluoview software and exported to a Microsoft Excel file.
Immunofluorescence and confocal microscopy:
Neutrophils were seeded on untreated coverglasses (Cole-Parmer, Vernon Hills, IL) and incubated at 37°C for 30 min, then fixed with 3.7% paraformaldehyde for 10 min, permeabilized with 0.01% saponin, and blocked with 1% BSA in PBS. Samples were labeled with the indicated primary antibodies overnight at 4°C in the presence of 0.01% saponin and 1% BSA. Samples were washed and subsequently incubated with appropriate secondary antibodies. Samples were analyzed with a Zeiss LSM 710 laser scanning confocal microscope attached to a Zeiss Observer Z1 microscope at 21 °C, using a 63× oil Plan Apo, 1.4 numerical aperture (NA) objective. Images were collected using ZEN-LSM software keeping the laser power and gain constant during all acquisitions for comparative analysis of wild type and knockout neutrophils or vehicle vs various inhibitor treatments. Images were then processed using ImageJ (National Institutes of Health, Bethesda, MD) and Photoshop CS4 (Adobe). The tail lengths and fluorescent intensities were quantified using the ImageJ software.
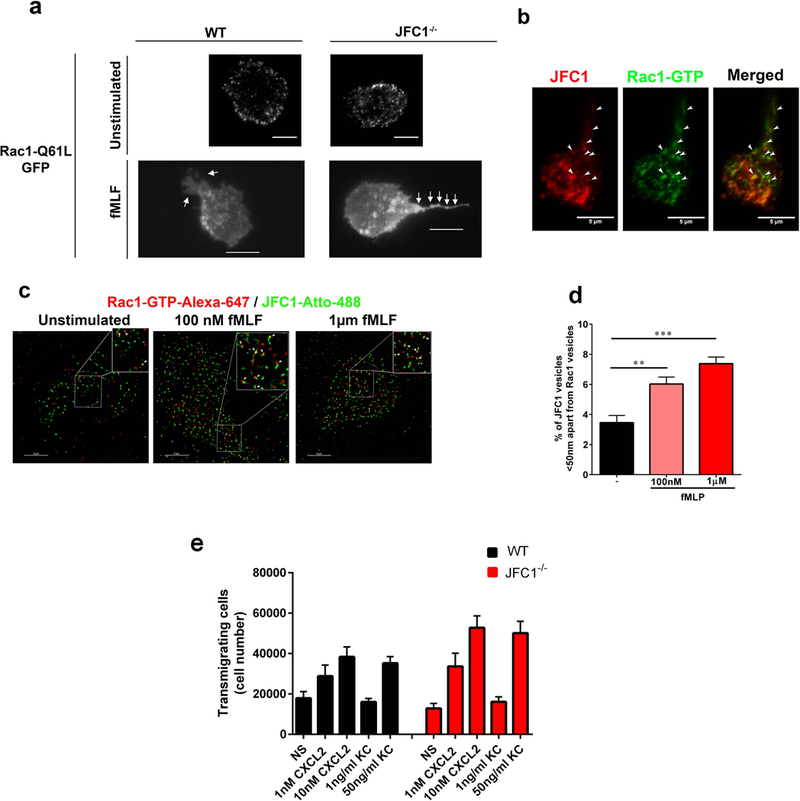
(a) The distribution of Rac1-Q61L transfected into primary WT or JFC1−/− neutrophils was analyzed by TIRF microscopy. Upper panels, representative images of unstimulated neutrophils are shown and representative dynamic studies are presented in supplementary movies S5 and S6. Lower panels, representative images of fMLF-stimulated neutrophils are shown. The white arrows point to the uropods of these cells showing accumulation of Rac1-Q61L-GFP in JFC1−/− but not in wild type neutrophils. Scale bars: 5 μm. (b) Immunofluorescence analysis of endogenous JFC1 (red) and Rac1-GTP (green) in neutrophilic-differentiated HL60 cells. Arrowheads indicate examples of vesicles that are positive for both JFC1 and Rac1 at the uropod and back body. Scale bar, 5 μm. (c) Super-resolution microscopy analysis (STORM) of the localization of endogenous JFC1 and Rac1-GTP in neutrophilic-differentialted HL60 cells. JFC1 and Rac1-GTP are detected adjacent to each other (arrowheads <50 nm apart) compatible with putative, in situ, protein-protein interaction; Scale bar, 5 μm. (d) Quantification of the super-resolution microscopy analysis showing the distance between JFC1 and Rac1-GTP centroids was performed as described under “Materials and Methods” and results are expressed as a percentage of total pairs at <50nm distance for each cell. A total of at least 10,000 JFC1 and Rac1-GTP pairs were analyzed from at least 4 individual cells. Mean ± S.E.M, **, p < 0.01, ***, p<0.001.(e) Chemotactic responses of wild type (WT, black bars) or JFC1−/− (red bars) neutrophils in response to the CXC chemokines CXCL2 and KC. Mean ± SEM, n=6 mice analyzed independently in two independent experiments. NS, non-stimulated.
Immunofluorescence and confocal microscopy:
Neutrophils were seeded on untreated coverglasses (Cole-Parmer, Vernon Hills, IL) and incubated at 37°C for 30 min, then fixed with 3.7% paraformaldehyde for 10 min, permeabilized with 0.01% saponin, and blocked with 1% BSA in PBS. Samples were labeled with the indicated primary antibodies overnight at 4°C in the presence of 0.01% saponin and 1% BSA. Samples were washed and subsequently incubated with appropriate secondary antibodies. Samples were analyzed with a Zeiss LSM 710 laser scanning confocal microscope attached to a Zeiss Observer Z1 microscope at 21 °C, using a 63× oil Plan Apo, 1.4 numerical aperture (NA) objective. Images were collected using ZEN-LSM software keeping the laser power and gain constant during all acquisitions for comparative analysis of wild type and knockout neutrophils or vehicle vs various inhibitor treatments. Images were then processed using ImageJ (National Institutes of Health, Bethesda, MD) and Photoshop CS4 (Adobe). The tail lengths and fluorescent intensities were quantified using the ImageJ software.
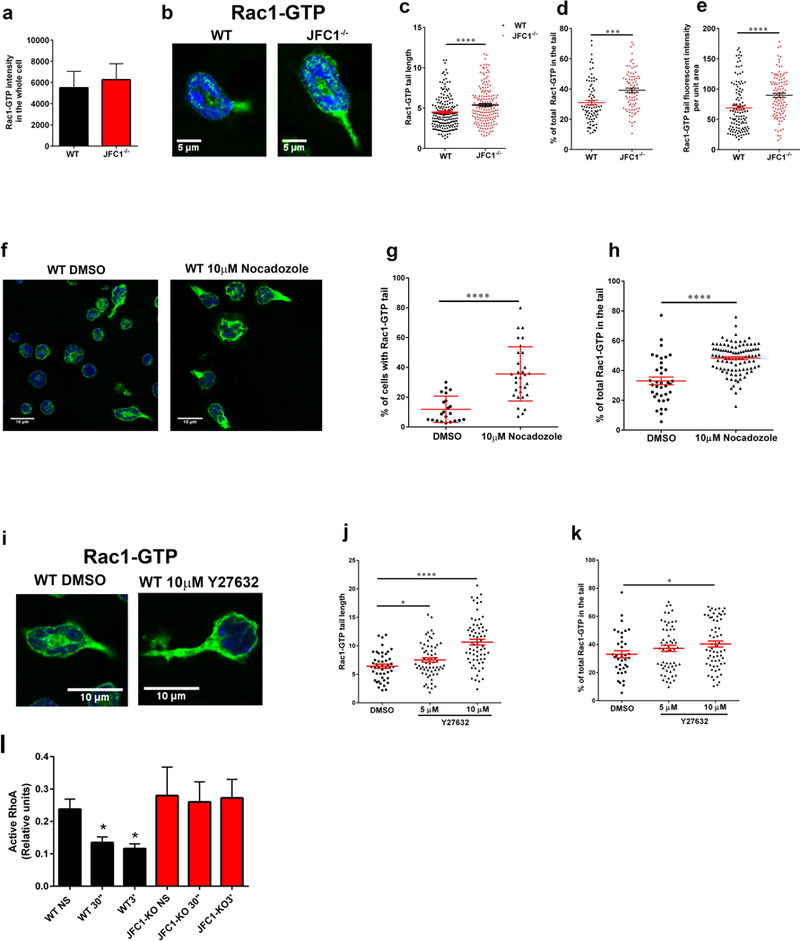
(a-e) Comparative quantitative analysis of the localization of endogenous active Rac1 in stimulated wild type and JFC1−/− neutrophils. (a) Quantitative analysis of total Rac1-GTP in neutrophils isolated from WT and JFC1−/− mice after stimulation with 100nM fMLF for 10 min at 37 °C. Active Rac1 was quantified using an antibody specific for the GTP bound form of Rac1 as described under “Material and Methods” and Rac1-GTP fluorescence intensity in the whole cell was analyzed using ImageJ. The data is indicated as mean± SEM of the arbitrary fluorescent units from an n=3 mice. (b) Representative images of WT and JFC1−/− cells showing Rac1-GTP accumulation in the tail upon fMLF stimulation for 10 min. (c) The length of Rac1-GTP uropods was analyzed using the ImageJ software. The data is expressed as mean ± SEM from a total of 180 cells from 3 independent experiments. (d) The % of total Rac1-GTP accumulated in the tail for each cell was calculated from the fluorescent intensity of Rac1-GTP in the uropod relative to the whole cell, measured using the ImageJ software. (e) The tail area was measured and Rac1 tail intensity per unit area was calculated using ImageJ. (c-e). WT (black circles); JFC1−/− (red triangles). Data are represented as mean ± SEM and were obtained from an n=4 mice. *** p<0.001, **** p<0.0001. (f-k) Effects of microtubule disruption (f-h) or ROCK inhibition (i-k) on the distribution of endogenous active Rac1 in WT neutrophils. Isolated neutrophils were seeded onto glass coverslips for 30 min, treated with the indicated inhibitors and stimulated with 100nM fMLF for 10 min at 37 °C. Active Rac1 was quantitatively analyzed by confocal microscopy as described above. (f) Representative image of WT and JFC1−/− cells showing Rac1-GTP accumulation in the tail upon treatment with 10μM Nocadozole followed by fMLF stimulation. (g) Percentage of total cells expressing Rac1-GTP-positive tails. (h) % of total (whole cell) Rac1-GTP accumulated in the tail for each Nocodazole- or vehicle-treated cell. (i) Representative images of WT and JFC1−/− cells showing Rac1-GTP accumulation in the tail upon treatment with 10μM Y27632 prior to fMLF stimulation. (j) The length of the Rac1-GTP tails in vehicle vs Y27632-treated cells. The data is expressed as mean ± SEM obtained from 3 independent experiments. (k) Percentage of total Rac1-GTP accumulated at the uropods of Y27632 or vehicle treated cells. n=3 mice. Mean ± SEM. (l) Quantitative analysis of RhoA activity in wild type (WT) and JFC1−/− neutrophils that have been left untreated (NS) or stimulated with fMLF for 30 seconds (30”) or for 3 minutes (3’). Mean ± SEM, n=3. *, p<0.05.
Immunocytochemistry
Slides (15 well μ-slides, 81506 Ibidi, Gräfelfing, Germany) were coated overnight with 10 μg/ml ICAM-1 (796-IC, R&D, Minneapolis, MN) or 5 μg/ml ICAM-1 for membrane dye experiments, washed with HBSS (L-2035 Biochrom, Berlin, Germany) and blocked with HBSS + 2% fatty acid-free BSA (Roth, Karlsruhe, Germany). Cultured CD4+ T cells were harvested at days 7–9, seeded on coated slides (20,000 cells/well), and incubated at 37°C for 45 min. Cells were fixed and permeabilized using Cytofix/Cytoperm solutions (554714, Becton-Dickinson, Heidelberg, Germany). Cells were incubated overnight with primary antibodies at 4°C and with secondary antibodies for 1 h, both diluted in Cytoperm, at room temperature and kept in PBS + 0.2% BSA for imaging. Antibodies used for immunoblotting and immunocytochemistry were: Cdc42-GTP (26905, New East Biosciences Biomol, Hamburg, Germany), Rac1-GTP (26903, New East Biosciences, Biomol, Hamburg, Germany)
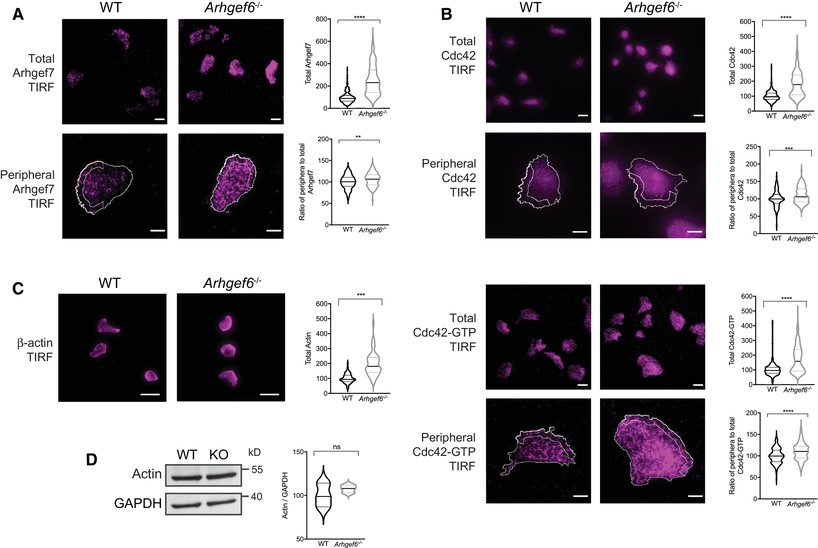
Increased expression of Arhgef7 and activity of Rac1 in Arhgef6−/− T cells.
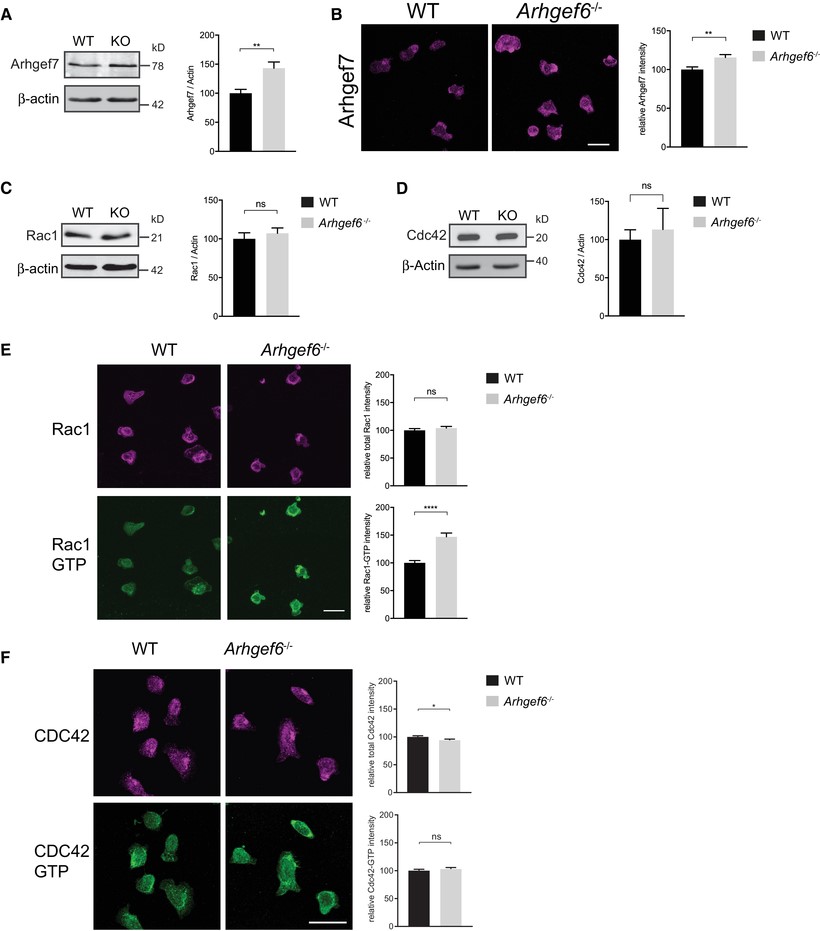
(A) Western blots of Arhgef7 in wild-type (WT) and Arhgef6−/− (KO) CD4+ T cells with densitometric quantification (n = 3 each). (B) Immunofluorescent images of CD4+ T cells stained for Arhgef7 and quantification of total fluorescence intensity (n = 61 WT and n = 66 KO cells pooled from 3 experiments, one mouse of each genotype per experiment). (C, D) Western blots of Rac1 (C) or Cdc42 (D) in WT and Arhgef6−/− CD4+ T cells with quantification (n = 3 each). (E) Immunofluorescent images of CD4+ T cells stained for Rac1 or Rac1-GTP show normal levels of Rac1 but a significant increase in Rac1-GTP to Rac1 ratios in Arhgef6−/− cells (n = 103 WT and n = 83 KO cells pooled from 4 experiments, one mouse of each genotype per experiment). (F) Immunofluorescent images of CD4+ T cells stained for Cdc42 and Cdc42-GTP show normal levels of activation (n = 315 WT and n = 308 KO cells pooled from 3 experiments, one mouse of each genotype per experiment). All quantifications show results from Arhgef6−/− cells normalized to WT results. ns = not significant, *P < 0.05, **P < 0.01, ***P < 0.001, by Student’s t-test. Values are mean ± SEM. Scale bars, 20 μm
Immunocytochemistry
Slides (15 well μ-slides, 81506 Ibidi, Gräfelfing, Germany) were coated overnight with 10 μg/ml ICAM-1 (796-IC, R&D, Minneapolis, MN) or 5 μg/ml ICAM-1 for membrane dye experiments, washed with HBSS (L-2035 Biochrom, Berlin, Germany) and blocked with HBSS + 2% fatty acid-free BSA (Roth, Karlsruhe, Germany). Cultured CD4+ T cells were harvested at days 7–9, seeded on coated slides (20,000 cells/well), and incubated at 37°C for 45 min. Cells were fixed and permeabilized using Cytofix/Cytoperm solutions (554714, Becton-Dickinson, Heidelberg, Germany). Cells were incubated overnight with primary antibodies at 4°C and with secondary antibodies for 1 h, both diluted in Cytoperm, at room temperature and kept in PBS + 0.2% BSA for imaging. Antibodies used for immunoblotting and immunocytochemistry were: Cdc42-GTP (26905, New East Biosciences Biomol, Hamburg, Germany), Rac1-GTP (26903, New East Biosciences, Biomol, Hamburg, Germany)
Cdc42 and actin mislocalized in Arhgef6−/− T cells.
(A) Wild-type (WT) and Arhgef6−/− (KO) CD4+ T cells were stained for Arhgef7 and imaged with total internal reflection fluorescence (TIRF) microscopy. TIRF was set to collect signals up to 200 nm from the cell/coverslip interface. Total Arhgef7 and the ratios of peripheral (outlined ROI at the 2 μm wide band of the leading edge over half the cell) to total Arhgef7 were quantified and normalized to the WT average of each experiment (n = 166 WT and n = 137 KO cells pooled from 3 experiments, one mouse of each genotype per experiment). Scale bars, 20 μm top panels, 5 μm bottom panels. (B) Cells imaged as in (A) but stained for Cdc42 or Cdc42-GTP (n = 266 WT and n = 249 KO cells pooled from 3 experiments, one mouse of each genotype per experiment for total Cdc42 and n = 147 WT and n = 149 KO cells pooled from 3 experiments for Cdc42-GTP). Scale bars, 20 μm top panels, 5 μm bottom panels. (C) Cells imaged as in (A) but stained for β-actin (n = 71 WT and n = 53 KO cells pooled from 3 experiments, one mouse of each genotype per experiment). Scale bars, 20 μm. (D) Western blot of β-actin with GAPDH as loading control with quantification normalized to WT (n = 3 experiments). ns = not significant, ***P < 0.001, ****P < 0.0001, by Student’s t-test. Values for (A–C) are median and quartiles and for (D) are mean ± SEM. Scale bars, 20 μm
Rac1-GTP measurement by flow cytometry
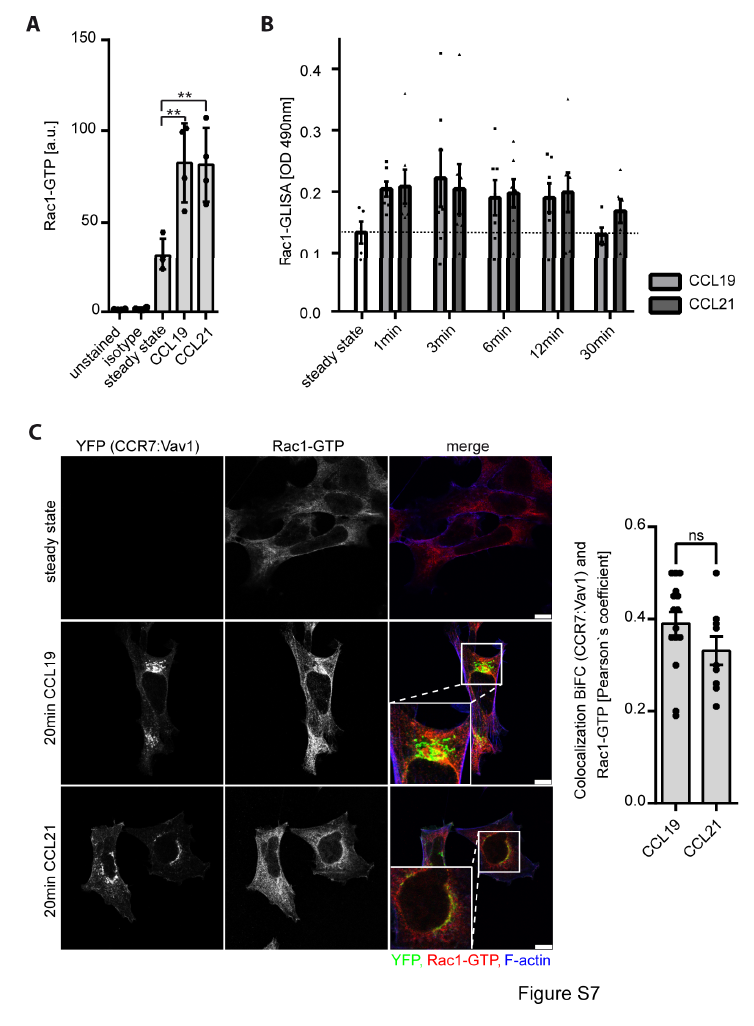
Figure S7. Rac1 is activated upon CCR7 stimulation and associates with the endomembrane residing CCR7:Vav1 signaling complex
(A) Chemokine-driven Rac1 activation in leukocytes. Primary human CD3+ T cells were stimulated with 0.5μg/ml CCL19 or CCL21 for 3min, fixed and permeabilized. Active Rac1 was stained using an antibody recognizing GTP-bound Rac1 and quantified by flow cytometry. Mean ± SEM for 4 individual donors. (B) Quantification of Rac1-GTP in human PBLs using Rac1-GLISA in cells stimulated or not with CCL19 or CCL21 (0.5μg/ml) for the indicated time points. Mean ± SEM of at least 5 individual donors. (C) Localization of active Rac1-GTP at the endomembrane CCR7:Vav1 BiFC complex with no ligand bias. HEK293 cells were transiently expressed with CCR7-YFP2 and Vav1-YFP1, stimulated for 20min with chemokines, stained with a specific antibody recognizing active Rac1-GTP and analyzed by confocal microscopy. Representative images derived from one experiment out of three. Colocalization of CCR7-YFP2:Vav1-YFP1 BiFC and Rac1-GTP (mean ± SEM) was analyzed by determining the Pearson`s correlation coefficient. Differences are statistically not significant (ns) in unpaired t-test. Scale bars: 10μm.
Fluorescence Microscopy
To characterize F-actin assembly and the Rac activity, purified Lin−/c-Kit+ cells were serum-starved in Iscove modification of DMEM (IMDM; Mediatech, Herndon, VA) and stimulated with or without the chemokine CXCL12 (100 ng/ml, from Peprotech, Rocky Hill, NJ) for 15 s. The cells were fixed with 2% paraformaldehyde (pH 7.4; Sigma) and permeabilized with 0.1% Triton X-100 (Sigma) for F-actin or cold icetone (50 and 100%) for Rac-GTP. After blocking in 2% BSA, the cells were stained with TRITC-conjugated phalloidin (Molecular Probes) and DAPI for F-actin or Rac-GTP (Neweast Bioscience, Malwern, PA) antibody followed by Alexa Fluor® 568 goat anti-mouse secondary antibody (Molecular Probes) and mounted for fluorescence imaging analysis (Zeiss fluorescence microscope). Images shown of F-actin staining are representative of more than 100 cells examined for each genotype. The fluorescence intensity of Rac1-GTP was measured by using the ImageJ (1.44p) software. At least 50 cells were examined for each genotype.
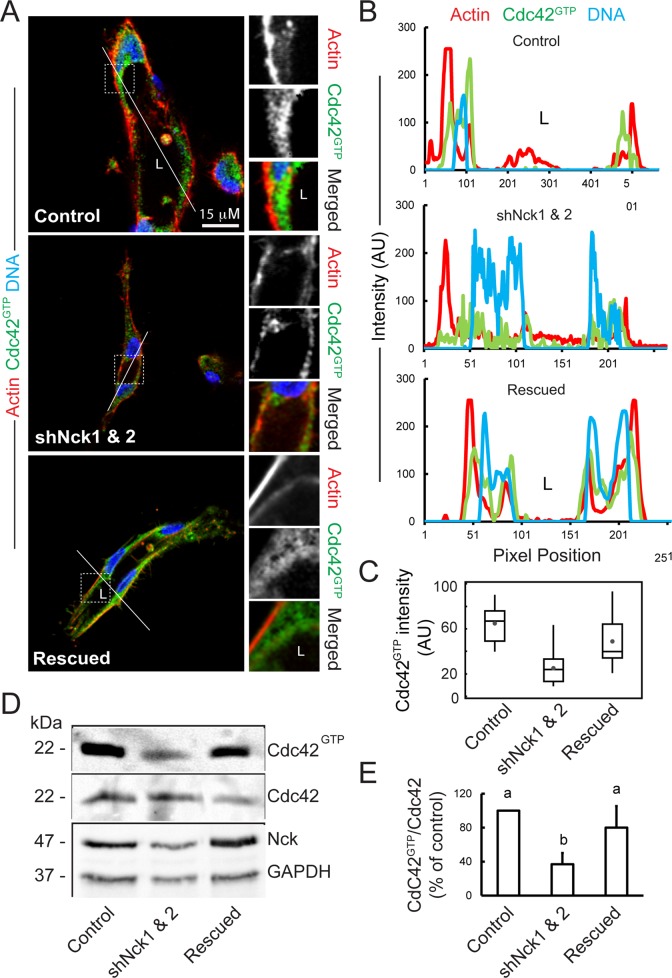
Loss of Nck disrupts activation of endogenous Cdc42 in cells cultured in 3D collagen matrices.
(A) Confocal images showing the cytoskeletal architecture (F-actin; red), distribution of GTP-bound Cdc42 (Cdc42GTP; green), and nuclei (DNA; blue). Lumens (L) are indicated. The ROIs (dotted squares) were magnified and are shown to the right. Scale bar, 15 μm. (B) Line scans showing intensities along the solid white lines displayed in A. (C) Quantification of luminal Cdc42 fluorescence intensity. Average pixel intensity was extracted from 35–50 ROIs from images acquired in three independent experiments. (D) Representative Western blots showing levels of GTP-bound Cdc42 (PBDPak1 pull-down assays), total Cdc42, Nck, and GAPDH in cell extracts obtained from 3D cultures. (E) Quantification of active Cdc42. The intensity of bands corresponding to active Cdc42 (PBDPak1 pull-down assays) was normalized by the intensity of bands corresponding to total Cdc42 in cell extracts and expressed as percentage of control cultures (n = 3 independent experiments).
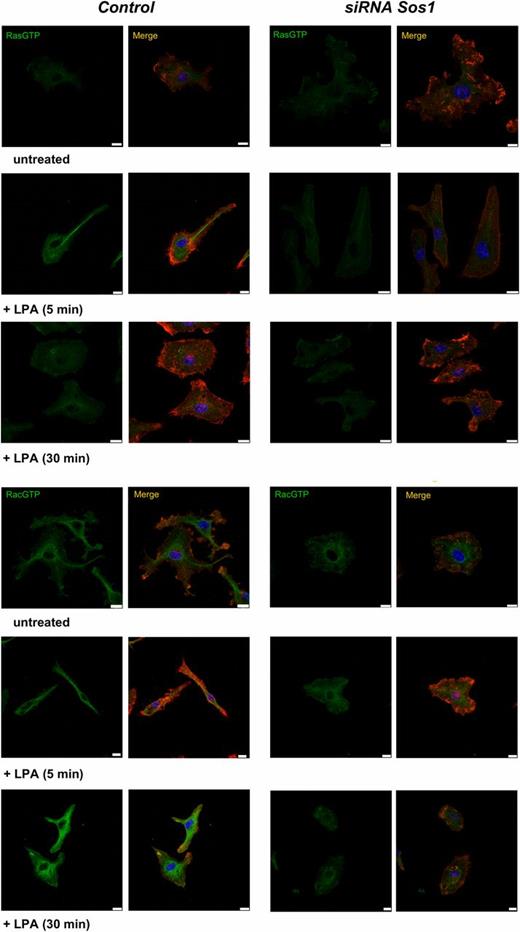
Immunostaining and confocal analysis
Macrophages were detached as described earlier and plated in 18-mm glass coverslips precoated with fibronectin or fibrinogen. Cells were fixed with 4% (w/v) paraformaldehyde for 30 min and, after washing with PBS and quenching with 50 mM NH4Cl, permeabilized with PBS-0.1% Triton X-100. After quenching with 1% BSA for 30 min, cells were stained with primary Abs for 1 h, washed with PBS, and then stained with secondary Abs and rhodamine-phalloidin for 30 min, followed by DAPI (Sigma Aldrich) for 10 min. Images of the ventral, substrate-adherent face of the cell were collected using the SP5 confocal microscope from Leica Microsystems (Mannheim, Germany) with a 63× objective (HCX PL APO λ blue 1.4NA OIL). Images were processed for brightness and contrast with Adobe Photoshop.
Rac1 and Ras are activated in an Sos1-dependent manner in BMDMs. Control nonsilencing siRNA pool and siRNA reagents targeting Sos1 were transfected by electroporation as described in 2Materials and Methods. After 72 h, cells were plated on glass coverslips, left to adhere, and stimulated with 3 μM LPA for the indicated times. BMDMs were then fixed and stained with Abs against Rac1GTP or RasGTP (green). F-actin (red) was labeled with rhodamine-phalloidin and nuclei (blue) with DAPI. Images were collected using an SP5 confocal microscope from Leica Microsystems with a 63× objective. Scale bars, 10 μm. Images are representative of those observed in experiments performed with three different cell pools. In each experiment performed, cells present in at least 10–15 fields of duplicate slides were examined.