


Published IH and IHC Pictures for 26905 Cdc42-GTP mAb - Part 01

Histology
Extracted premolars were immersed in 4% paraformaldehyde (PFA) for cell fixation and then decalcified in 10% EDTA (pH 7.4; BE021, Bio solution Co. Ltd., Korea) for 3 days at 50°C. The paraffin-embedded specimens were sectioned into 7 μm. Hematoxylin and eosin and Masson’s trichrome staining were performed after deparaffinization.
………….
For immunofluorescence staining, the slides were incubated with Proteinase K (10 μg/ml, AM2546, Thermo Scientific, United States) for 20 min at 37°C. Subsequently, the slides were incubated with antibodies against acetylated-tubulin (Ac-Tub, 1: 1,000 diluted, T7551, Sigma-Aldrich, United States), vascular endothelial growth factor (VEGF, 1: 200 diluted, sc-53462, Santa Cruz, United States), active RhoA (1: 100 diluted, 26904, NewEast Biosciences, United States), and VEGFR2 (1:100 diluted, 24795, CST, United States) at 4°C overnight. The specimens were sequentially incubated with secondary antibodies (Invitrogen, OR, United States) for 2 h at room temperature and were counterstained with DAPI (D1306, Invitrogen, OR, United States; 30 nM). Fluorescence detection was performed according to the manufacturer’s protocols and examined using a confocal laser microscope (DMi8, Leica, Germany).
Effect of BBS7 knockdown on the primary PDL cell migration.
(A) GFP-labeled PDL cells are stained with Ac-Tub (red), and nuclei are stained with TO-PRO-3 (blue). The primary cilia (arrowhead) were observed in the control group. PDL cells were spindle-shaped in the control group, whereas they were round in shape in the shBBS7 group. (B) Relative mRNA expression of Shh signaling molecules. Compared to the control group, the expression of PTCH1 and GLI1 was significantly decreased in the shBBS7 group. (C) Immunoblotting with Ptch1, Gli1, and GAPDH antibodies. The Ptch1 and Gli1 protein expressions were significantly decreased in the shBBS7 group. (D) Actomyosin cytoskeleton–related kinase is stained with active RhoA (red), and nuclei are stained with TO-PTO-3 (blue). (E) Immunoblotting with active RhoA, ROCK1, and GAPDH antibodies. The active RhoA and ROCK1 protein expressions were significantly decreased in the shBBS7 group. (F) PDL cell migration was examined by wound-healing assay (control, shBBS7, and Y-27632 group). The scratched and recovering of wounded areas were marked by white dotted lines. Representative images were captured at 0, 24, and 48 h. The shBBS7 group showed delayed wound closure compared to control and Y-27632 groups. (G) Quantification of migration distance in shBBS7 and Y-27632 groups was significantly lower than the control group. (H) The wound-healing area of shBBS7 and Y-27632 groups was significantly lower than the control group. (I) The representative trajectory plots depicting the path of the individual PDL cell movement. The trajectories were displayed by using position parameters and shifted to a common origin. The directional movement was observed in the control group, while the cell in shBBS7 and Y-27632 groups had low persistence to migration; scale bars: A, D, 25 μm; F, 400 μm **p < 0.001. Ac-Tub: acetylated-tubulin; Con: control.
Immunostaining of tissue
Enucleated human eyes were purchased from Lions Eye Institute for Transplant and Research or Singapore General Hospital. Paraffin sections of 4 µm were used for immunohistochemistry withLeica Bond Polymer Refine detection kit DS9800. Slides were heated for 20 min at 60°C and then loaded onto Leica Bond III autostainer for antigen retrievel using Leica Bond ER2 solution for 20 min at 100°C, antibody incubation follow suit. Primary (1:100) and secondary (1:300) antibodies were diluted in 10% FBS, 0.1% PBS-Tween; and incubated overnight at 4 °C and 1 h at RT, respectively. Vectashield with 40,6-diamidino-2-phenylindole (DAPI) was applied to the tissues and coverslipped. Confocal microscopy was performed with a Leica SP8 confocal microscope.
Immunofluorescence of cells
Cells were grown on glass coverslips and fixed in 4% PFA for 1 h at 4 °C. Cells were blocked in blocking buffer (5% BSA, 0.05% TX-100, PBS) for 1 h at room temperature and incubated overnight in the respective primary antibodies at 4 °C. Cells were then washed 3 times for 15 min with PBS and incubated with fluorescently-tagged secondary antibodies for 1 h at room temperature followed with addition of Vectashield Anti-fade Mounting Medium with DAPI before coverslipped for analysis.
Figure 3
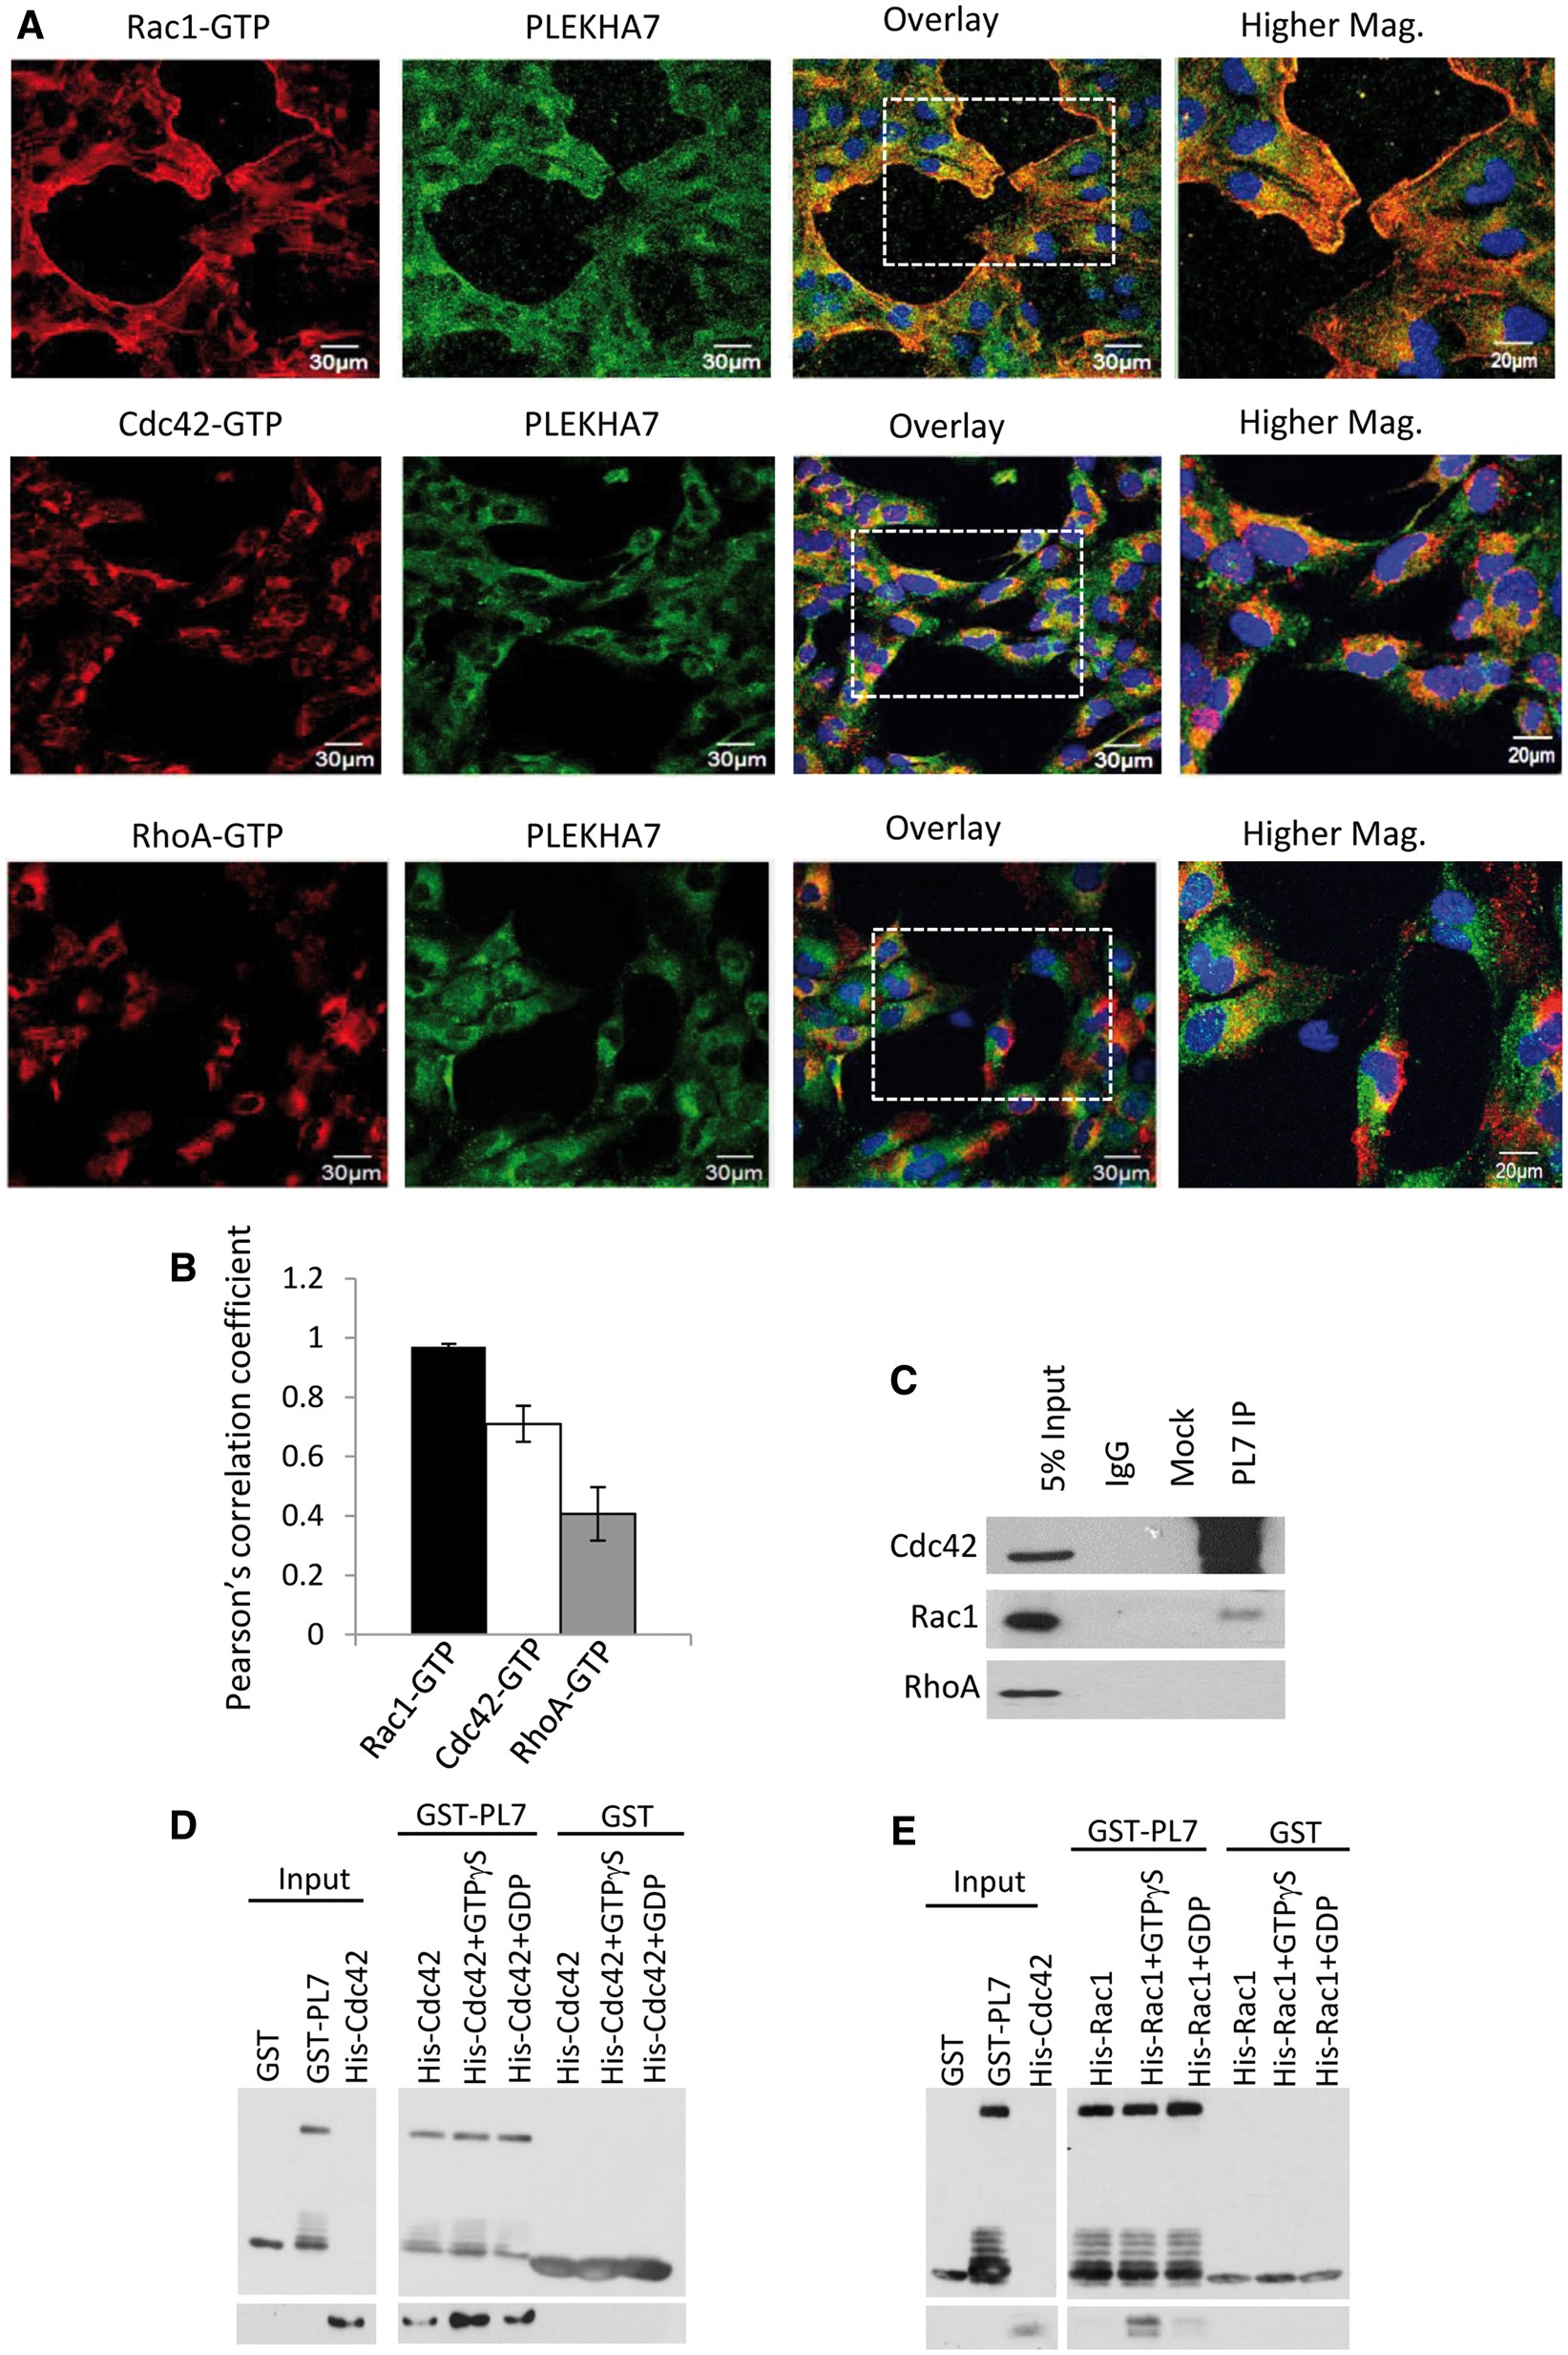
PLEKHA7 is a specific interactor of Rac1 and Cdc42. (A) Representative time-lapse fluorescence microscopy images of h-iNPCE cells during cell migration. Endogenous PLEKHA7 (green), Rac1-GTP (red), Cdc42-GTP (red) and RhoA-GTP (red) were labelled and analysed. Scale 20 μm. (B) The spatial relationship between PLEKHA7 and respective RhoGTPases were analysed with Pearson Pearsonearsonth Pearsoent (all conditions n > 40). Error bars represent ±SEM. Value of 0 denotes no linear correlation while positive values closer to 1 denote positive correlation of protein pair evaluated. (C) PLEKHA7 co-immunoprecipitated with Cdc42 and Rac1 from untransfected h-iNPCE cells. (D,E) In vitro protein binding assays between recombinant proteins. Full-length GST-tagged PLEKHA7 were incubated with either unbound, GTPγS bound or GDP bound His-tagged Cdc42 or Rac1 and analysed by western blot analysis.
Immunostaining of tissue
Enucleated human eyes were purchased from Lions Eye Institute for Transplant and Research or Singapore General Hospital. Paraffin sections of 4 µm were used for immunohistochemistry withLeica Bond Polymer Refine detection kit DS9800. Slides were heated for 20 min at 60°C and then loaded onto Leica Bond III autostainer for antigen retrievel using Leica Bond ER2 solution for 20 min at 100°C, antibody incubation follow suit. Primary (1:100) and secondary (1:300) antibodies were diluted in 10% FBS, 0.1% PBS-Tween; and incubated overnight at 4 °C and 1 h at RT, respectively. Vectashield with 40,6-diamidino-2-phenylindole (DAPI) was applied to the tissues and coverslipped. Confocal microscopy was performed with a Leica SP8 confocal microscope.
Immunofluorescence of cells
Cells were grown on glass coverslips and fixed in 4% PFA for 1 h at 4 °C. Cells were blocked in blocking buffer (5% BSA, 0.05% TX-100, PBS) for 1 h at room temperature and incubated overnight in the respective primary antibodies at 4 °C. Cells were then washed 3 times for 15 min with PBS and incubated with fluorescently-tagged secondary antibodies for 1 h at room temperature followed with addition of Vectashield Anti-fade Mounting Medium with DAPI before coverslipped for analysis.
Figure 7
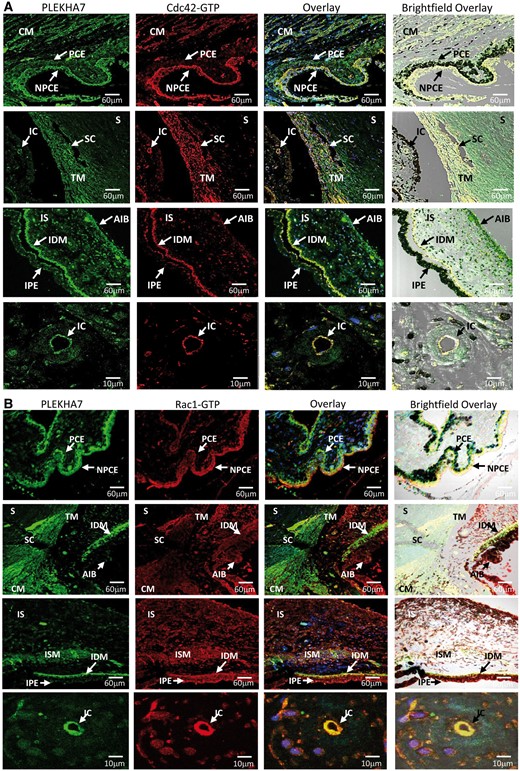
Cdc42-GTP and Rac1-GTP colocalize and interact with PLEKHA7 in PACG-related BAB structures. (A) Coimmunofluorescence of PLEKHA7 (green) with Cdc42-GTP (red) is highly expressed in non-pigmented ciliary epithelium (NPCE) and ciliary muscle (CM) but at moderate levels in pigmented ciliary epithelium (PCE). Partial colocalization of PLEKHA7 with Cdc42-GTP is observed in trabecular meshwork (TM) next to SchlemmKH canal (SC) with no fluorescence detected for both PLEKHA7 and Cdc-42-GTP in sclera (S). PLEKHA7 and Cdc42-GTP was highly expressed in iris dilator muscle (IDM) and at moderate level in iris stroma (IS), anterior iris border (AIB) and iris pigmented epithelium (IPE). When observed with higher magnification power, PLEKHA7 and Cdc42-GTP colocalized strongly in endothelium of iris capillaries (IC). (B) Rac1-GTP (red) coimmunolabelled with PLEKHA7 (green) showed strong immunopositive signals in BAB-related structures such as NPCE, TM, IDM, CM, IC and iris sphincter muscle (ISM).
Immunofluorescence Staining
NRK‐49F cells were seeded (1 × 10⁴ cells mL−1) into 24‐well plates containing rounded glass cover slips. Cells were incubated with or without TGF‐β1 (10 ng mL−1), followed by the addition of 5 µM DA or vehicle (DMSO). Following 12 or 48 h of treatment, cells were washed and fixed with ice‐cold 4% paraformaldehyde (JTW003, Tongmen technology). Cells were then permeabilized with 0.2% Triton X‐100 (T8200, Solarbio), and blocked with 5% donkey serum (D9663, Sigma) for 1 h at room temperature, followed by incubation with primary antibodies: anti‐α‐SMA‐Cy3 (Sigma C6198, 1:2000), anti‐β‐catenin (CST 8480, 1:100) or anti‐active Cdc42 (NewEast Biosciences 26905, 1:100) overnight at 4 °C. Coverslips were then incubated with AlexaFlour 488‐conjugated donkey anti‐rabbit secondary antibody (Invitrogen A21206, 1:1000) for 1 h at room temperature. The cells were counterstained with DAPI (Invitrogen D1306, 1:1000) to visualize the nuclei. Images were taken by laser scanning confocal microscopy (Zeiss, Jena, Germany).
As for mouse renal tissue sections, the kidneys were fixed in 4% paraformaldehyde overnight and then dehydrated in 30% sucrose for 8 h at 4 °C. Kidneys were then embedded in paraffin and cut into 6‐µm‐thick sections. The sections were permeabilized and blocked as demonstrated above, followed by incubation with anti‐β‐catenin and anti‐α‐SMA‐Cy3 antibodies overnight at 4 °C. The slides were stained with fluorescence‐labeled secondary antibodies for 1 h at room temperature. Nuclei were stained with DAPI. The slides were observed using the Zeiss microscope.
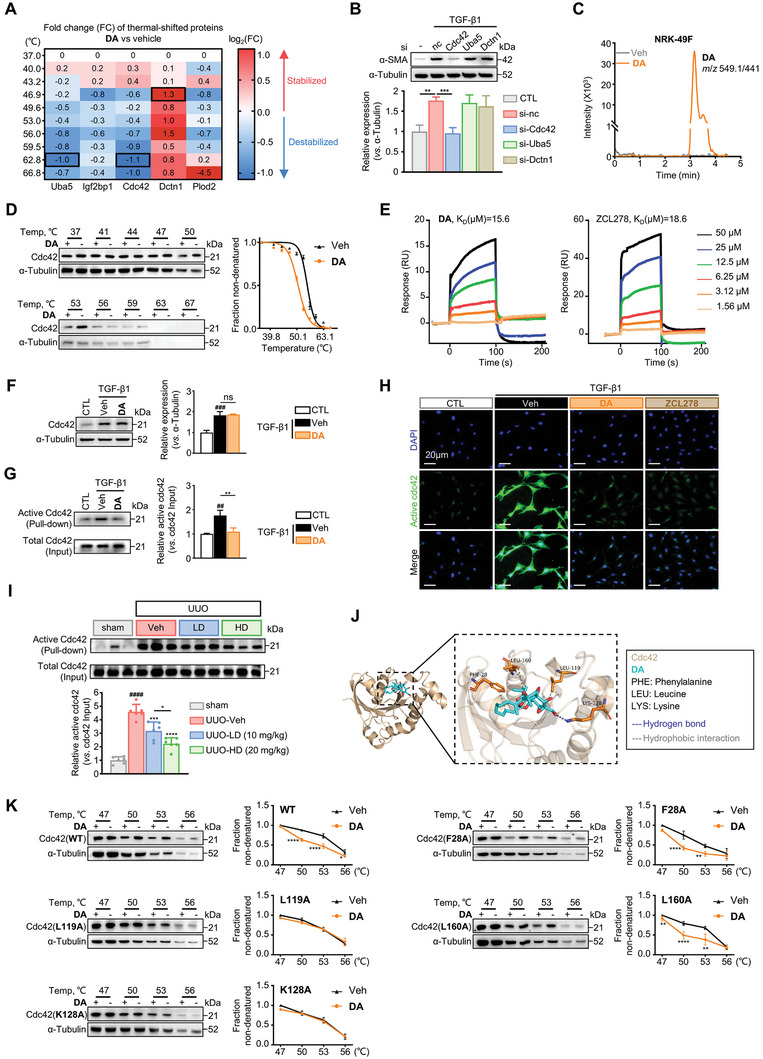
…. G) Analysis of the active and total Cdc42 in NRK‐49F cells treated with vehicle or DA by pull‐down assay. Quantitative analysis of the grey value for active Cdc42/total Cdc42 ratio using ImageJ software (n = 3 per group). H) Representative immunofluorescence microscopy of active Cdc42. Serum‐starved NRK‐49F cells were treated with vehicle, 5 µM DA, or 5 µM ZCL278. Cells were probed with an active Cdc42 antibody (green). Nuclei were visualized by DAPI (blue). Scale bar, 20 µm. I) Analysis of the active and total Cdc42 in kidneys from mice treated with vehicle, low‐dose, or high‐dose DA by pull‐down assay (n = 6 per group). Results were quantified by ImageJ software. J) Molecular docking of Cdc42 and DA. K) CETSA analysis of intracellular binding between DA and wild‐type or mutant Cdc42 (n = 3 per group). Data were analyzed by two‐way ANOVA followed by Bonferroni’s multiple comparisons test. Control, CTL; vehicle, Veh; WT, wild‐type; F, Phe; K, Lys; L, Leu. Data are presented as means ± SEM (B, D, F, G, I, and K) and were analyzed using one‐way ANOVA followed by a Bonferroni’s multiple comparisons test unless otherwise stated. ## p < 0.01, ### p < 0.001, #### p < 0.0001 compared with CTL or sham group; * p < 0.05, ** p < 0.01, *** p < 0.001, **** p < 0.0001 compared with Veh group or between groups indicated by a line; ns, not significant.
Immunofluorescence staining and evaluation
Cells seeded on coverslips for more than 24 h were fixed in 4% formaldehyde for 30 min at room temperature, then permeabilizated with 0.1% Triton X-100 for 30 min. After that, cells were treated with the primary antibody overnight at 4°C, followed by incubation with species-specific secondary antibody for two hours at room temperature. The coverslips were mounted using an antifade mounting solution containing 4,6-diamidino- 2-phenylindole (DAPI; P36935, Invitrogen) after three-time washing with phosphate-buffered saline (PBS). Actin was stained with Myo10 (Rabbit, HPA024223, Sigma-Aldrich) and Rhodamine Phalloidin (R415, Invitrogen) following the manufacturer’s instructions. Confocal images were captured using ZEISS LSM 880 confocal microscope with Airyscan (Carl Zeiss, Germany) or Leica TCS SP8 confocal microscope (Leica, Switzerland), and fluorescence quantification was measured as described previously 9. Co-localization analysis was performed via Leica Application Suite X (LAS X).
Regulation of CDC42 activity by NDRG1 in CRC cells.
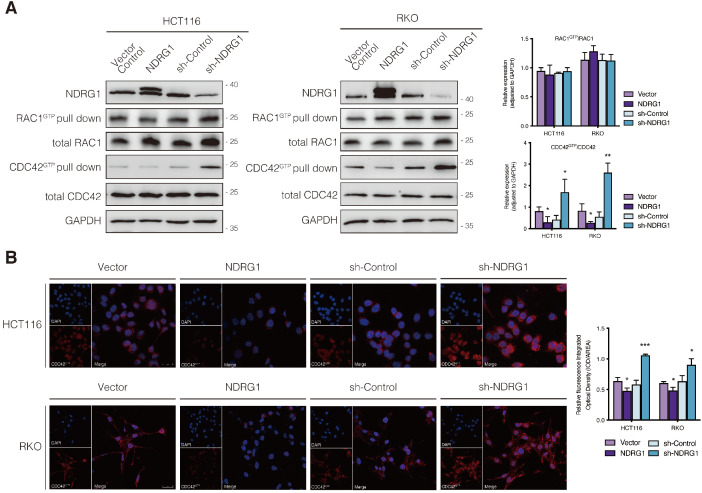
A) Immunoblotting for total protein level or activated form of indicated Rho GTPase in NDRG1-modified HCT116 and RKO cells. Results are representative of at least three biological repeats, and the values in histograms are represented by mean ± S.D.; *P value <0.05, **P value <0.01, relative to the respective control cells. B) Confocal images were taken to show immunofluorescence staining of active-CDC42 (red) accompanied by the cell nucleus (blue) stained by DAPI in NDRG1 overexpression and NDRG1 knockdown HCT116 and RKO cells relative to the control cells, respectively. Fluorescence quantification was performed by comparing the integrated optical density (IOD)/area value of active-CDC42 to the IOD/area value of the nucleus (DAPI) in the same image. Results are representative of three to five images from different visual fields, and the histogram values are mean ±S.D. *P value <0.05, ***P<0.001, relative to the respective control cells. Scale bars: 25 µm.
Immunostaining and confocal microscopy
Hela cells were grown for 5 days on glass cover slides and HCE cells for 4 days in 48-well plates. On the last day, cells were fixed with cold methanol (−20 °C) for 10 min at −20 °C. The cells were then rehydrated with PBS for 5 min and blocked with PBS (0.5%), bovine serum albumin (BSA) (0.1%) and NaN3 for 15 min at room temperature. For actin staining, cells were fixed with 3% paraformaldehyde (PFA) in PBS, pH 7.4, for 20 min at room temperature, permeabilized with 0.5% Triton in PBS–BSA for 5 min and then incubated with PBS containing 0.5% BSA and 20 mM Glycine for 5 min. For microtubules staining, cells were prefixed at 37 °C for 15 min with 4% PFA diluted in a microtubules stabilization buffer (80 mM Pipes-NaOH pH 6.8/1 mM MgCl2, 1 mM EGTA and 0.1% Triton). They were then left at −20 °C in methanol for 3 min. Methanol was discarded, cells rehydrated with PBS for 5 min, and blocked with PBS (0.5%), BSA (0.1%) and NaN3 for 15 min at room temperature. HCE cells transiently transfected with DLC2 and Kif1B domain constructs were fixed in either methanol (5 min at −20 °C) or 3% PFA as described for Hela cells. The following primary antibodies were used: α-tubulin (Abcam—ab18251, rabbit, 1:200); β-catenin (Santa Cruz—sc31001, goat, 1:200); E-cadherin (BD Bioscience—610182, mouse, 1:1,000); Occludin (Invitrogen—33-1500, mouse, 1:1,000); p120-catenin (BD Bioscience—610134, mouse, 1:250); ZO-1 (1:200) (ref. 22); Kif1B (Bethyl Laboratories—A301-056A, Inc., rabbit, 1:200); DLC2 (Santa Cruz—sc67843, goat, 1:200; Santa Cruz—sc377054, mouse, 1:100); α-catenin (Sigma—C2081, rabbit, 1:200); GFP (Sigma—G1546, mouse, 1:200); HURP (Santa Cruz—sc68539 goat, 1:200); PRC-1 (Santa Cruz—sc8356, rabbit, 1:200); mDia3 (ECM Bioscience—DP4511, rabbit, 1:200); CREST (Sera Lab—AI-15-235-F, 1:1,000); APC (SantaCruz—sc7930, rabbit, 1:200); phospho-S100hDsn1 (kindly provided by Iain Cheeseman); Cdc42-GTP (NewEast Biosciences—26905, mouse, 1:100). Secondary antibodies conjugated to FITC, Cy3 or Cy5 that had been generated in Donkey and cross-absorbed (Jackson ImmunoResearch, Inc.) were reconstituted as instructed by the provider, brought to 50% glycerol and then used at a dilution of 1:300. For staining of F-actin, fluorescently labelled Phalloidin was mixed with the secondary antibodies, and for DNA detection Hoechst 33258 was used21. For confocal microscopy, a Leica TCS SPE confocal microscope with a 63x/NA1.4 objective and Leica Application Suite (LAS) software were used. Pictures were processed with Adobe Photoshop. Epifluorescence images were acquired with a Nikon Eclipse Ti-E inverted microscope using an Apochromat × 60,1.4 NA oil immersion objective, a CoolSNAP HQ2 camera (Photometrics), and Nikon software.
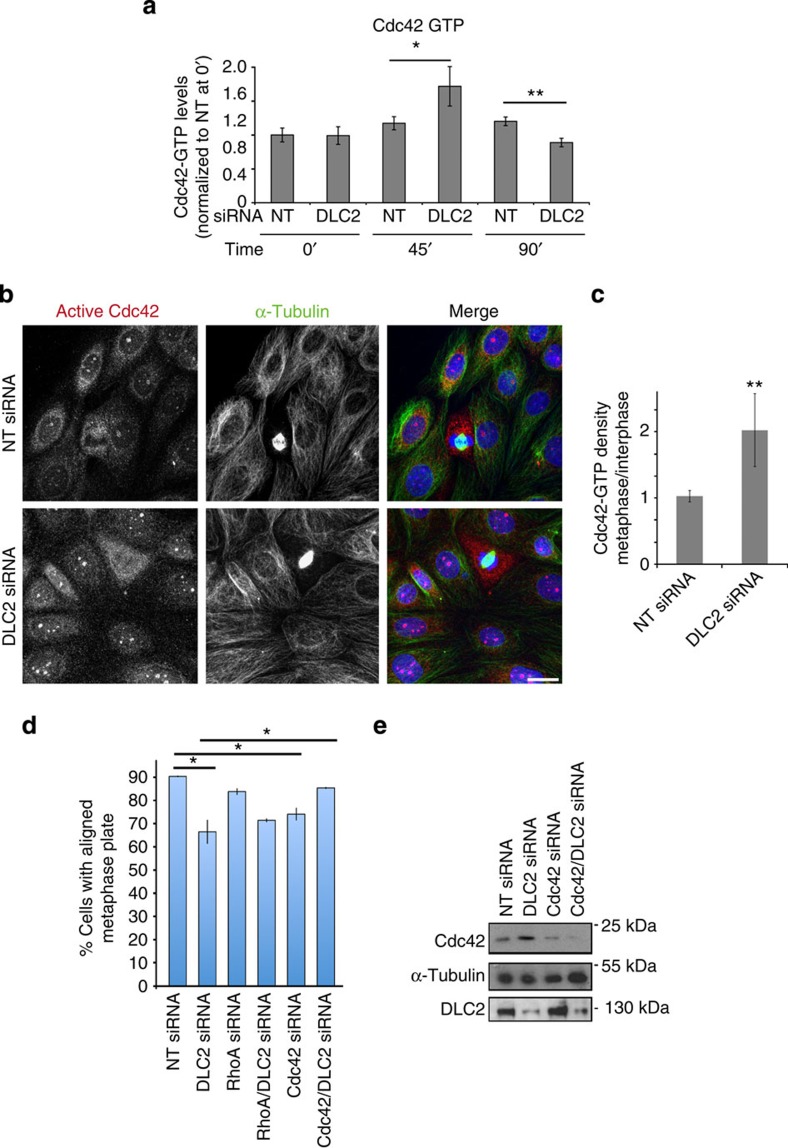
DLC2 regulates Cdc42 in metaphase.
(a) Cdc42 activity assays of control (NT, non-targeting) and DLC2 siRNA-transfected HCE cells that had been synchronized with Nocodazole. Time points analysed after Nocodazole washout were 0, 45 and 90 min (shown are means±1 s.d.; n=3 experiments; 45-min washout corresponds to metaphase cells; values were normalized to control cells at time 0). (b) HCE cells transfected with control and DLC2 siRNAs were stained with antibodies against active Cdc42 and α-tublin, as well as DNA (blue). (c) Quantification of fluorescence intensity was performed by calculating the ratio of mean intensities measured in metaphase and interphase cells (shown are means±1 s.d.; **P<0.01; n=3 experiments). (d) Count of aligned metaphase plates. HCE cells were transfected with non-targeting, DLC2, Cdc42, RhoA, Cdc42 and DLC2, RhoA and DLC2 siRNAs. The cells were then fixed and stained for α-tubulin and DNA, and cells with aligned and misaligned metaphase plates were counted (shown are means±1 s.d.; n=3 experiments). (e) Total extracts of HCE cells transfected with siRNAs as indicated were analysed by immunoblotting for Cdc42, DLC2 and α-tubulin. (*P<0.05, **P<0.01; t-test).
Histological analysis and fluorescence microscopy
For immunofluorescence staining of LN sections, LNs were isolated and fixed in 2% paraformaldehyde, 0.1% Triton-100, and 1% DMSO for 24 h before cryoprotection with 30% sucrose in PBS for an additional 24 h. Tissues were cryosectioned at 10 µm thickness and blocked in buffer composed of PBS containing 2% BSA and 5% donkey serum. Tissues were stained overnight in blocking buffer containing AF488-conjugated B220 (clone RA3-6B2; BioLegend), and AF594-conjugated CD3 (clone 17A2; BioLegend). Sections were washed in PBS and mounted with prolong glass hardset mounting medium (ThermoFisher). High-resolution images were acquired using a Marianis spinning disk confocal microscope (Intelligent Imaging Innovations) equipped with a 40× 1.3-NA objective; 405-nm, 488-nm, 561-nm, and 647-nm laser lines and a Prime 95B CMOS camera (Photometrics); and analyzed using Slidebook software (Intelligent Imaging Innovations). For immunofluorescence staining of thymus, freshly frozen thymi were cryosectioned and stained as outlined above using biotinylated UEA-1 lectin (Vector Labs). Sections were washed in PBS before incubation with AF568-conjugated streptavidin (ThermoFisher) and 10 nM DAPI. Samples were mounted with prolong glass hardset medium and imaged using confocal microscopy as outlined above.
For immunofluorescence staining of thymocytes, mature and semimature CD4SP thymocytes were rested in RPMI 1640 medium supplemented with 0.1% fatty acid–free BSA (Sigma) for 2 h at 37°C. Medium alone or medium containing 1 µg/ml CCL19 chemokine (final concentration) was added and cells were stimulated for 5 min. Cells were then analyzed following fixation in 4% paraformaldehyde, permeabilization with 0.1% Triton-100, and incubation with mouse anti-Cdc42 (26905; NewEast Bioscience) diluted at 1:400 in PBS containing 2% BSA and 5% donkey serum. Cells were washed and incubated with donkey anti-mouse CF568-conjugated secondary antibody (Biotium) and AF499-conjugated phalloidin (for staining actin; ThermoFisher). Cells were imaged using a 1.4-NA 100× objective and confocal microscope outlined above and analyzed using Slidebook software. Shape factor index was used as a measure of polarization, where the ratio of the longest axis to the shortest axis having a value >1 would indicate elongation and actin polarization.
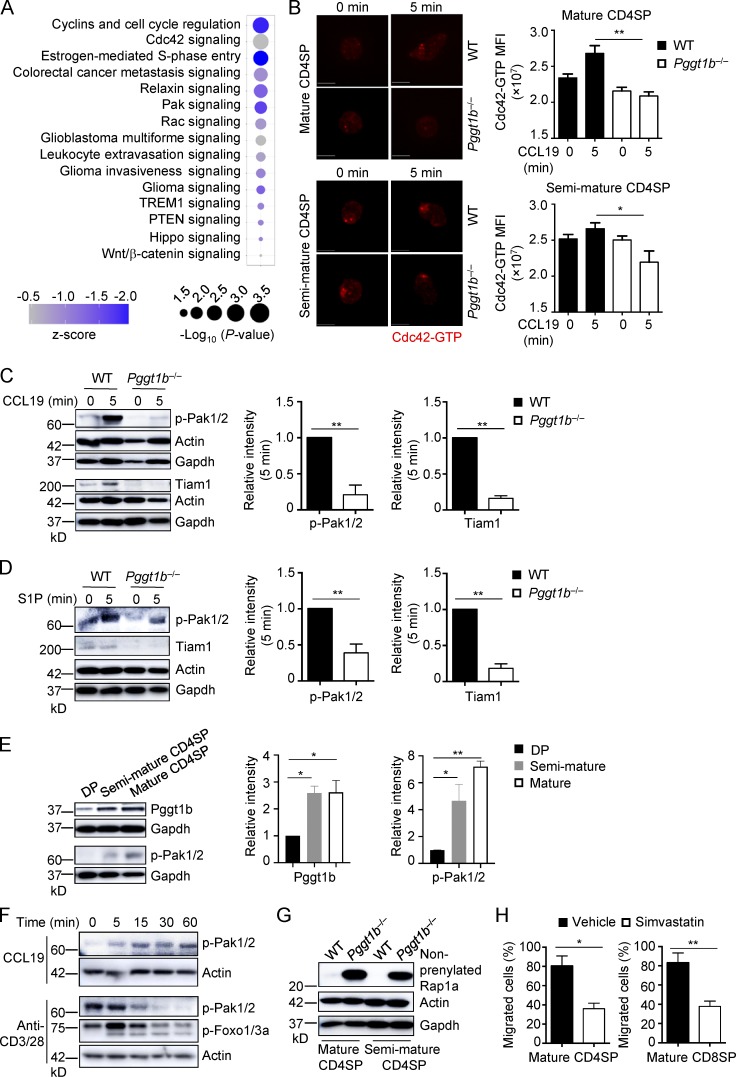
Pggt1b integrates Cdc42, Pak signaling, and lipid metabolism in thymocyte trafficking, and its expression is up-regulated during thymocyte maturation.
(A) Ingenuity Pathway Analysis of differentially expressed genes between WT and Pggt1b-deficient CD4SP cells identified in microarray assay. The top 15 down-regulated (z-score < 0) pathways are shown. (B) Representative immunofluorescent images (left) and MFI (right) of Cdc42-GTP expression in mature (top) and semimature (bottom) CD4SP thymocytes from WT and Pggt1b−/− mice after stimulation with CCL19 for 5 min. Scale bar, 5 μm. (C) Immunoblot analysis (left) and quantifications (right; after normalization to actin) of p-Pak1/2 and Tiam1 expression in mature CD4SP thymocytes from WT and Pggt1b−/− mice upon CCL19 stimulation. (D) Immunoblot analysis (left) and quantifications (right; after normalization to actin) of p-Pak1/2 and Tiam1 expression in mature CD4SP thymocytes from WT and Pggt1b−/− mice upon S1P stimulation. (E) Immunoblot analysis (left) and quantifications (right) of Pggt1b and p-Pak1/2 expression in different thymic T cell populations of WT mice. (F) Immunoblot analysis of p-Pak1/2 or p-Foxo1/3a expression in mature CD4SP thymocytes from WT mice upon CCL19 or anti-CD3/28 stimulation. (G) Immunoblot analysis of nonprenylated Rap1a expression in mature and semimature CD4SP thymocytes from WT and Pggt1b−/− mice. (H) Chemotactic response of mature CD4SP and CD8SP thymocytes from WT mice pretreated with simvastatin or vehicle for 5 d. Migration through 5-µm transwells in response to CCL19 was assessed by flow cytometry. Data are shown as mean ± SEM. *, P < 0.05; **, P < 0.01; one-way ANOVA in B and E and two-tailed unpaired Student’s t test in C, D, and H. Data are from two (B and E–H) or three (C and D) independent experiments.
Confocal immunofluorescence microscopy
Membrane and cytosolic localization of β-Arrestin1–mCherry or mCherry only were imaged against Alexa 488-labelled WGA, a widely used fluorescent marker that binds to cell membranes (Crossman et al., 2015) in Caco-2, ShPTEN, HCT116 and PTEN −/− cells, with or without LPA treatment. We used a Leica SP8 confocal microscope and Leica LAS-X software for line scanning of fluorescent images. Caco-2 ShPTEN (ShPTEN) glands and organoid cultures were incubated in 4% PFA for 20 min and processed for immunofluorescence as previously described (Jagan et al., 2013a; Deevi et al., 2016; Jagan et al., 2013b). Briefly, 3D cultures were fixed in PFA for 20 min at room temperature and permeabilized for 10 min in 0.5% Triton X-100 in PBS. The 3D cultures were rinsed with PBS/glycine buffer for 15 min to reduce autofluorescence and blocked by incubation in IF Buffer (PBS with 0.1% bovine serum albumin, 0.2% Triton X-100, 0.05% Tween-20)+10% goat serum, for 1–1.5 hr at room temperature. Primary antibodies were diluted in blocking buffer and incubated overnight at 4°C. The 3D cultures were incubated with secondary antibodies and/or FITC-labeled phalloidin for 1 hr. DNA was stained using Vectashield mounting medium containing DAPI (Vector Scientific, Belfast, NI). Sequential scan images were taken the midsection of glands/organoids at room temperature using a Leica SP5 confocal microscope [RRID:SCR_012314] on a HCX PL APO lambda blue 63 × 1.40 oil immersion objective at 1x or 2x zoom. Images were collected and scale bars added using LAS AF confocal software (Leica) [RRID:SCR_013673]. We assessed effects of transfection or treatment on signal intensity, spindle orientation, lumen formation and/or epithelial configuration in in 3D glands or organoids at 4 days of culture. Because imaging for apical protein kinase C zeta (PRKCZ) was unsuccessful in organoids, the apical domain was imaged using FITC-labelled phalloidin as a marker of apical actin.
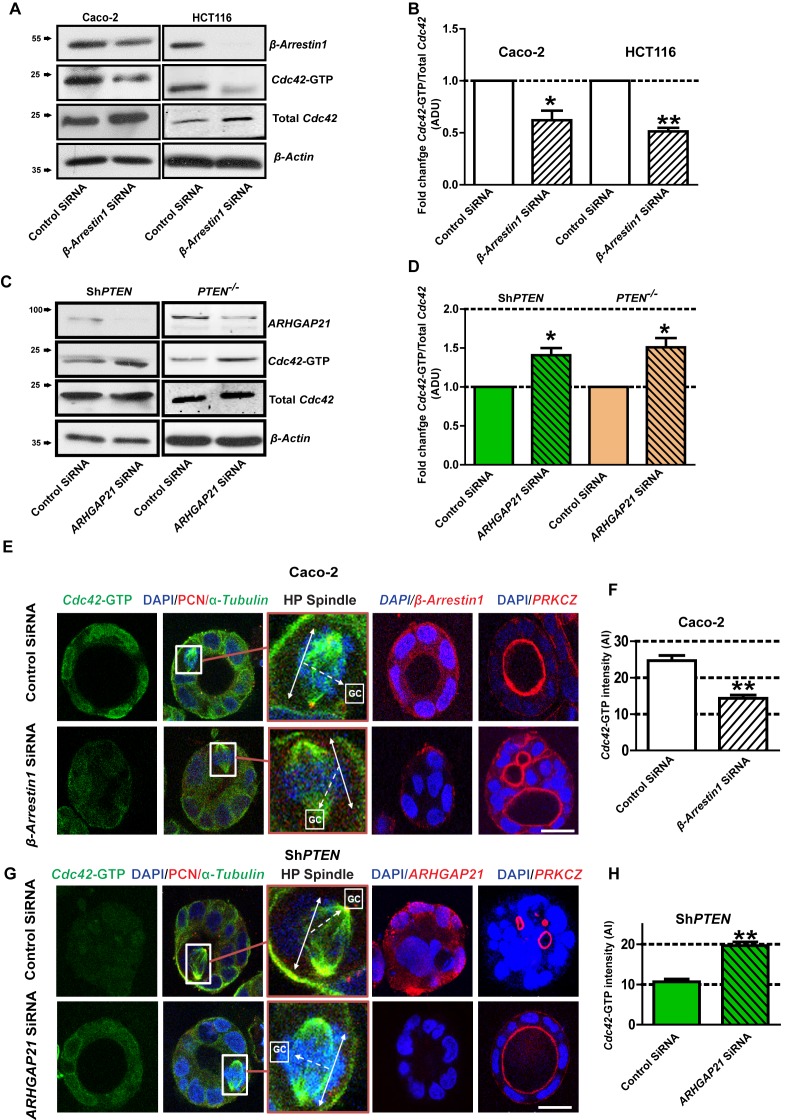
PTEN controls morphogenesis through Cdc42/β-Arrestin1/ARHGAP21 interactions.
(A,B) SiRNA β-Arrestin1 knockdown (KD) suppresses Cdc42-GTP in Caco-2 and HCT116 cells (fold changes = 0.62 ± 0.09;*p=0.03 and 0.51 ± 0.03;**p=0.005 respectively. (C,D) SiRNA ARHGAP21 KD enhances Cdc42-GTP in Caco-2 ShPTEN (ShPTEN) and HCT116 PTEN -/- (PTEN -/-) cells (fold change = 1.41 ± 0.09 and 1.51 ± 0.11, respectively; *p=0.02 for each. Cdc42-GTP ADU was normalized against total Cdc42. (E) SiRNA β-Arrestin1 KD suppresses Cdc42-GTP signal intensity, impairs spindle orientation and inhibits single lumen formation. High-power (HP) spindle views (orange border) enlarge areas within white rectangles and show orientation angles (interrupted white arrows) of spindle planes (double-headed solid white arrows) toward gland centres (GCs). Normal spindle planes are orientated at approximately 900 angles relative to gland centres [GCs] (Jaffe et al., 2008). Summary SiRNA effects on spindle angles relative to GCs are shown in Figure 2—figure supplement 1. (F) Summary SiRNA effects on Cdc42-GTP intensity shown in (E) – control vs β-Arrestin1 SiRNA = 24.67 ± 1.45 vs 14.33 ± 0.88 AI units; **p=0.004. β-Arrestin1 KD also suppresses single central lumen formation in 3D Caco-2 cultures (E; Figure 2—figure supplement 2). (G) SiRNA ARHGAP21 KD increases Cdc42-GTP signal intensity (H), rescues spindle orientation (G, Figure 2—figure supplement 3) and central lumen formation in ShPTEN 3D cultures (G, Figure 2—figure supplement 4). (H) Cdc42-GTP, control vs SiRNA ARHGAP21 KD in ShPTEN cultures = 10.67 ± 0.67 vs=19.67 ± 0.88 AI units; **p<0.01. Assays at 4 days of culture. Imaging Cdc42-GTP [green], pericentrin (PCN) [red], α-Tubulin [green], ARHGAP21 [red], PRKCZ [red], β-Arrestin1 [red] and DAPI [blue]. All experiments conducted in triplicate. All analyses by paired Student’s t test. Scale bars 20 µm. Molecular weights indicated by arrows in blots.
Immunocytochemistry
Slides (15 well μ-slides, 81506 Ibidi, Gräfelfing, Germany) were coated overnight with 10 μg/ml ICAM-1 (796-IC, R&D, Minneapolis, MN) or 5 μg/ml ICAM-1 for membrane dye experiments, washed with HBSS (L-2035 Biochrom, Berlin, Germany) and blocked with HBSS + 2% fatty acid-free BSA (Roth, Karlsruhe, Germany). Cultured CD4+ T cells were harvested at days 7–9, seeded on coated slides (20,000 cells/well), and incubated at 37°C for 45 min. Cells were fixed and permeabilized using Cytofix/Cytoperm solutions (554714, Becton-Dickinson, Heidelberg, Germany). Cells were incubated overnight with primary antibodies at 4°C and with secondary antibodies for 1 h, both diluted in Cytoperm, at room temperature and kept in PBS + 0.2% BSA for imaging. Antibodies used for immunoblotting and immunocytochemistry were: Cdc42-GTP (26905, New East Biosciences Biomol, Hamburg, Germany), Rac1-GTP (26903, New East Biosciences, Biomol, Hamburg, Germany)
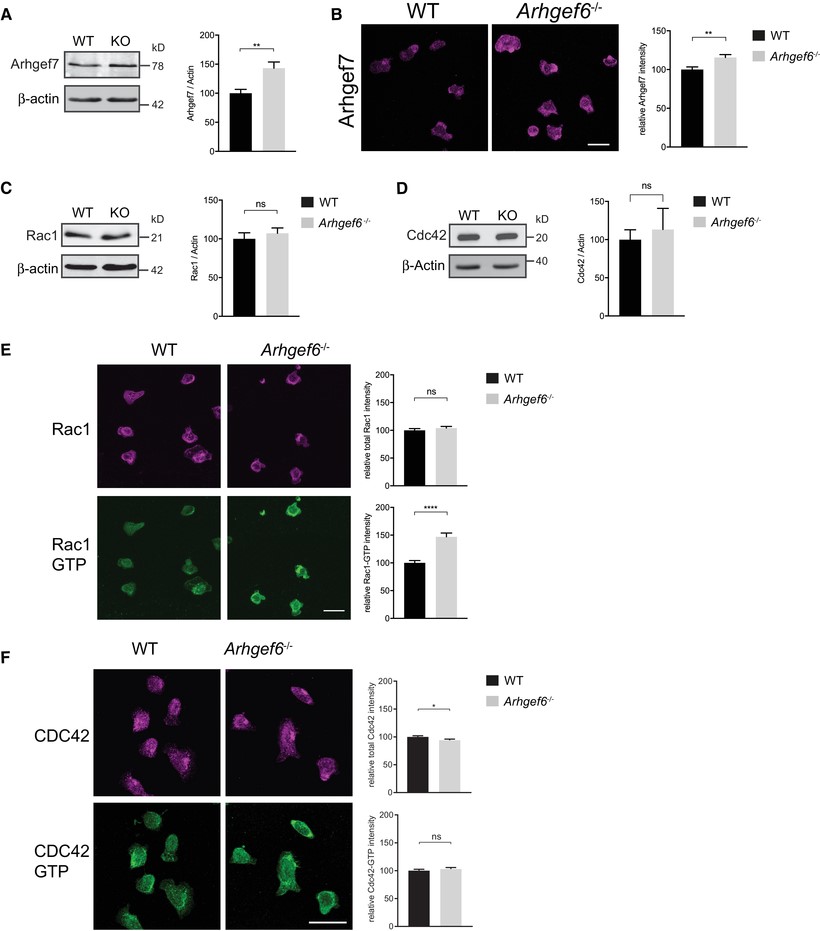
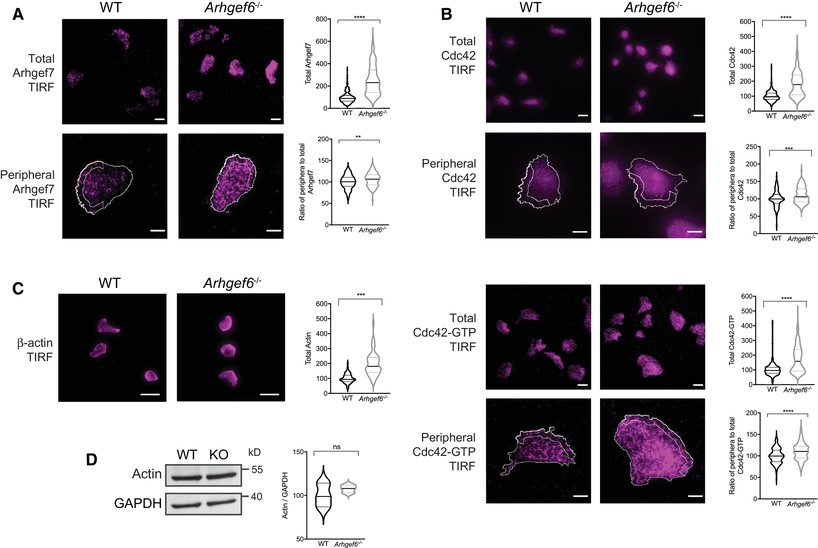
Increased expression of Arhgef7 and activity of Rac1 in Arhgef6−/− T cells.
(A) Western blots of Arhgef7 in wild-type (WT) and Arhgef6−/− (KO) CD4+ T cells with densitometric quantification (n = 3 each). (B) Immunofluorescent images of CD4+ T cells stained for Arhgef7 and quantification of total fluorescence intensity (n = 61 WT and n = 66 KO cells pooled from 3 experiments, one mouse of each genotype per experiment). (C, D) Western blots of Rac1 (C) or Cdc42 (D) in WT and Arhgef6−/− CD4+ T cells with quantification (n = 3 each). (E) Immunofluorescent images of CD4+ T cells stained for Rac1 or Rac1-GTP show normal levels of Rac1 but a significant increase in Rac1-GTP to Rac1 ratios in Arhgef6−/− cells (n = 103 WT and n = 83 KO cells pooled from 4 experiments, one mouse of each genotype per experiment). (F) Immunofluorescent images of CD4+ T cells stained for Cdc42 and Cdc42-GTP show normal levels of activation (n = 315 WT and n = 308 KO cells pooled from 3 experiments, one mouse of each genotype per experiment). All quantifications show results from Arhgef6−/− cells normalized to WT results. ns = not significant, *P < 0.05, **P < 0.01, ***P < 0.001, by Student’s t-test. Values are mean ± SEM. Scale bars, 20 μm
Immunocytochemistry
Slides (15 well μ-slides, 81506 Ibidi, Gräfelfing, Germany) were coated overnight with 10 μg/ml ICAM-1 (796-IC, R&D, Minneapolis, MN) or 5 μg/ml ICAM-1 for membrane dye experiments, washed with HBSS (L-2035 Biochrom, Berlin, Germany) and blocked with HBSS + 2% fatty acid-free BSA (Roth, Karlsruhe, Germany). Cultured CD4+ T cells were harvested at days 7–9, seeded on coated slides (20,000 cells/well), and incubated at 37°C for 45 min. Cells were fixed and permeabilized using Cytofix/Cytoperm solutions (554714, Becton-Dickinson, Heidelberg, Germany). Cells were incubated overnight with primary antibodies at 4°C and with secondary antibodies for 1 h, both diluted in Cytoperm, at room temperature and kept in PBS + 0.2% BSA for imaging. Antibodies used for immunoblotting and immunocytochemistry were: Cdc42-GTP (26905, New East Biosciences Biomol, Hamburg, Germany), Rac1-GTP (26903, New East Biosciences, Biomol, Hamburg, Germany)
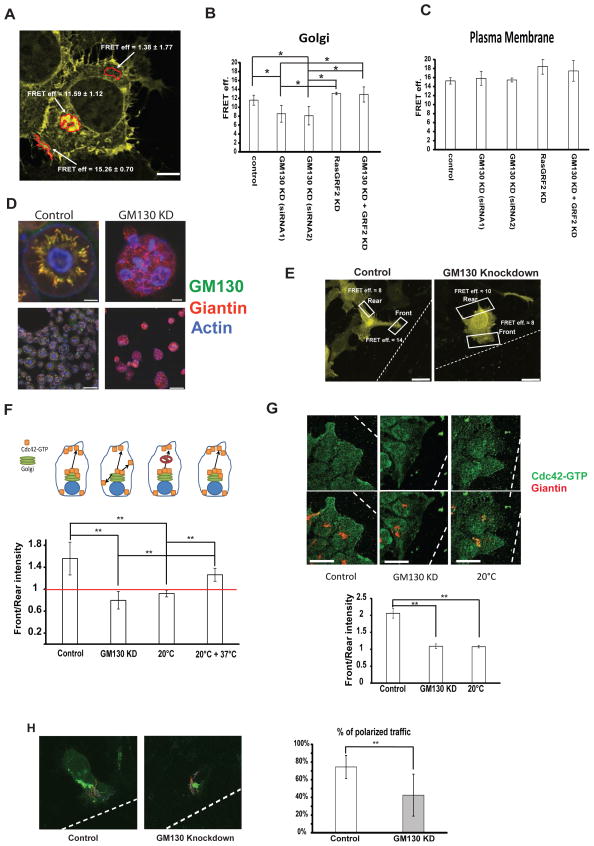
GM130 spatially regulates Cdc42 activity to control polarity
(A) ….. (E) HeLa cells were transfected with the indicated siRNA. After 48 h, cells were transfected with a plasmid encoding the Cdc42-EM Raichu probe. After 24 h, a wound was generated using a 10 μl pipette tip and cells were allowed to migrate and polarize for approximately 6 h at 37°C followed by fixation. Representative images of cells expressing the Raichu probe that are facing the wound are shown. FRET was measured on the plasma membrane part facing the wound (indicated as “Front”) and on the opposing end of the cell (indicated as “Rear”). Scale bar is 10 μm. (F) Graphic representation of FRET measurements from three independent experiments of HeLa cells expressing the indicated Raichu probe and that that were transfected with the indicated siRNA 72 h prior to the experimental measurements. Above the graph a schematic of the experimental setup: control cells have Cdc42-GTP at the Golgi and deliver it to the leading edge in a polarized way. GM130 knockdown cells have less Cdc42-GTP at the Golgi and lose the ability to polarize their traffic towards the leading edge. Blocking post-Golgi traffic by incubation at 20°C abolishes front-rear asymmetry and re-warming the cells to 37°C re-established asymmetry. White bars represent Front/Rear ratios of FRET values. Results are means ± SD from four independent experiments. Asterisks indicate statistically significant differences tested using ANOVA with Newman-Keuls multiple comparison test (** p<0.01). (G) HeLa cells were transfected with siRNA. After 72 hours, a wound was made with a 10 μl tip and the cells were allowed to migrate for 6 hours. Cells were then fixed and immunostained for Giantin and Cdc42-GTP. Intensities of Cdc42-GTP were measured and the Front/Rear ratio is plotted as a bar graph. Results are means ± SD of 3 independent experiments. Asterisks indicate statistically significant differences tested using ANOVA with Newman-Keuls multiple comparison test (** p<0.01). Scale bar = 25 μm. (H) HeLa cells were transfected with the indicated siRNA. After 48 h, cells were transfected with the plasmid encoding for VSVG-RUSH-GFP. After further 24 h, a wound was made with a 10 μl tip and cells were allowed to migrate at 37°C for approximately 6 hours followed by live video microscopy. VSVG-RUSH-GFP was released from the ER by addition of biotin and after 25 min VSVG carriers were tracked using ImageJ. Individual tracks are displayed on the representative images. Results are means ± SD from three independent experiments. Asterisks indicate statistically significant differences tested using Student’s T-test (** p<0.01).
Method Details
Tissue preparation and histological analysis
Euthanized mice were first perfused using PBS and then 4% paraformaldehyde (PFA) in PBS. Mouse mandibles were dissected away from the rest of the cranium and fixed with 4% PFA in PBS overnight at 4°C. Mandibles were subsequently washed with PBS, dehydrated in 70% ethanol in water through serial ethanol washes, and equilibrated to paraffin using Leica ASP300S. Mandibles were then embedded in paraffin and sectioned at 6 μm. Hematoxylin & Eosin (H&E) staining was carried out using standard protocols.
Immunofluorescence staining
For immunofluorescence, paraffin sections were rehydrated, and antigen retrieval was performed by sub-boiling slides in pH 6.2 citrate buffer containing 10mM citric acid, 2mM EDTA, 0.05% Tween 20 using microwave for 15 minutes. For YAP immunostaining, samples were additionally washed with 2N HCl for 5 minutes. Primary and secondary antibodies used and corresponding dilutions were summarized in Table S4. Samples were blocked in 1X animal-free blocker (Vector Laboratories), supplemented with 2.5% heat inactivated goat serum, 0.02% SDS and 0.1% Triton-X. All antibodies were diluted in the same block without serum. For detection of CDC42-GTP, ITGA3 (Aggarwal et al., 2014), PCAD, p4EBP, pFAK, pMerlin, pS6K1, pSRC, pYAP, RHEB, SerpinH1, TAZ, and YAP, primary antibodies were first detected by biotinylated secondary antibodies (Table S4), and then sequentially amplified using VECTASTAIN Elite ABC HRP Kit (Vector Laboratories) and Tyramide Signal Amplification (PerkinElmer). DAPI (Invitrogen) was used for nuclear staining and all images were acquired using a Leica-TCS SP5 confocal microscope. TUNEL staining was performed according to manufacturer’s instructions (Sigma-Aldrich).
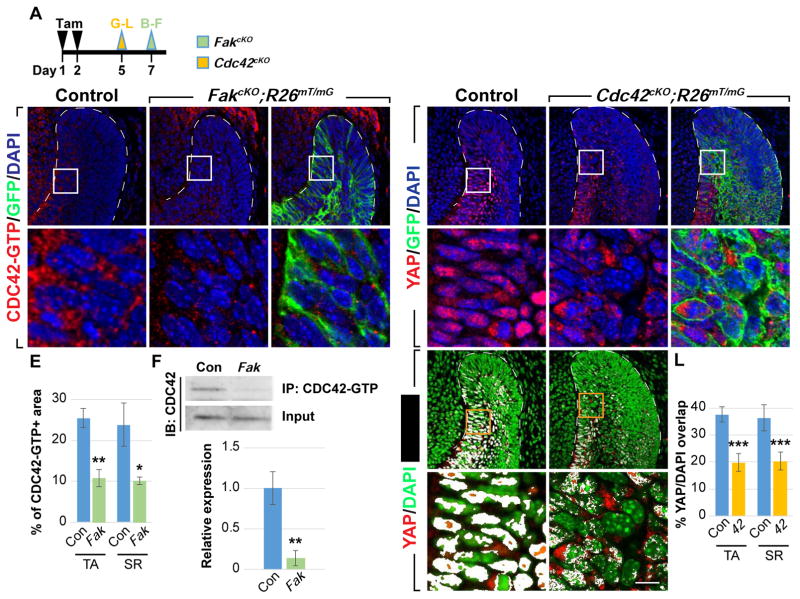
CDC42 acts downstream of FAK to regulate YAP nuclear localization
(A) Timeline depicting tamoxifen (Tam) treatment (black arrowheads) and sample collection (green and yellow arrowheads).
(B–E) Immunostaining of active CDC42 in control and FakcKO laCLs. The percentage of area with positive CDC42-GTP staining is calculated (E).
(F) Immunoprecipitation of CDC42-GTP followed by CDC42 immunoblotting. Relative expression between control and FakcKO is quantified.
(G–L) YAP immunostaining in control and Cdc42cKO laCLs. The percentage of YAP/DAPI overlap is quantified (J–L).
Immunofluorescence and Total Internal Reflection Fluorescence (TIRF) Microscopy
Purified human neutrophils (2×10⁶/ ml) were incubated on fibronectin-coated surfaces at 37°C for 1 hr in the presence of inhibitors or vehicle (DMSO), followed by stimulation with fMLP. After fixation with 4% paraformaldehyde for 5 min, cells were permeabilized with 80% acetone for 3 min and blocked with blocking buffer (10% fetal bovine serum, 5 mg/ml BSA in PBS) for 10 min. For phospho-PAK staining, cells were permeabilized with methanol. Neutrophils were stained with anti-PAK1/2/3 pThr423 (1∶100), anti-PAK2 pSer20 (1∶50), anti-Rac (1∶100), anti-active Rac-GTP (1∶100), anti-active RhoA-GTP (1∶200), anti-active Cdc42-GTP (1∶100) anti-myosin light chain2 pSer19 (1∶200), anti-vinculin (1∶100), or anti-actin (1∶100) in blocking buffer overnight at 4°C. Secondary antibodies conjugated with AlexaFluor 488 or AlexaFluor 546 (1∶500) and/or TRITC-phalloidin (1∶1000) in blocking buffer were added and incubated for 2 hr in dark. Coverslips were mounted onto glass slides and visualized with a Zeiss Axiovert fluorescent microscope. For TIRF microscopy, purified neutrophils were plated in 8-well chamber slide (Nunc) and treated with vehicle or inhibitors followed by stimulation with fMLP. Cells were fixed, permeabilized and stained for vinculin as described above. Vinculin immunofluorescence in a focal section of the neutrophil within ∼150 nm from the surface of coverslip was excited with a 488 nm-laser and detected via TIRF microscopy using a Nikon TE300 microscope equipped with a Nikon 60× oil immersion objective (NA = 1.49) and an electron multiplied CCD camera. For data presentation, fluorescent intensities of each image were adjusted based on signals detected in neutrophil samples treated without primary antibody.
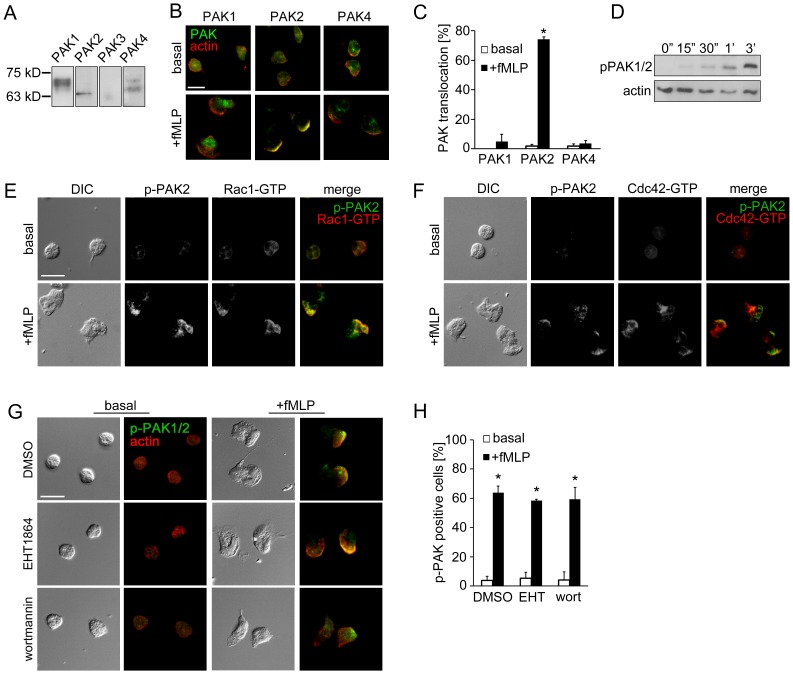
Replicate samples of total neutrophil (PMN) cell lysates (50 µg per lane) were analyzed for (A) the expression of PAK1 (68 kD), PAK2 (61 kD), PAK3 (65 kD) and PAK4 (72 kD) or (D) phosphorylation of PAK1/2 Thr432/402 at indicated time points after the addition of fMLP (10 nM) by Western blot. Human neutrophils adherent on fibronectin surfaces were treated in the presence or absence of fMLP (10 nM) for 3 min and stained for (B) PAK1, PAK2 or PAK4 (green) and F-actin (red), (E) phospho-PAK2 Ser20 (green) and Rac1-GTP (red), (F) phospho-PAK2 Ser20 (green) and Cdc42-GTP (red), or (G) phospho-PAK1/2 Thr423/402 (green) and F-actin (red). In selected experiments, neutrophils were pretreated with vehicle (0.1% DMSO), EHT1864 (Rac1/2 inhibitor, 50 µM) or wortmannin (PI3K inhibitor, 100 nM). Results are quantified from at least 60 cells and presented as the mean percentage±SEM of (C) neutrophils displaying PAK immunofluorescence at actin-rich leading edge, or (H) neutrophils displaying phospho-PAK1/2 immunofluorescence in the fields of view. Representative images obtained from 3 independent experiments are shown. * P<0.05, compared to the basal level. Scale ba = 10 µm.

Cells suspended at 2 × 10⁶/ml in standard adhesion buffer were stimulated as indicated. After a washing step, cells were fixed in ice-cold 4% formaldehyde for 20 minutes and stained in permeabilization buffer (PBS; 0.5% saponin, 4 mM azide, 10% FCS) containing antiactive RhoA or antiactive CDC42 antibody for 30 minutes at 4°C. After incubation with FITC-conjugated secondary antibody in permeabilization buffer (30 min at 4°C), cells were analyzed by cytofluorimetric quantification using a MACSQuant Analyzer.
Figure 7. Impairment of RhoA and CDC42 activation in cystic fibrosis (CF) monocytes.
(A) A guanosine triphosphate (GTP)–binding assay was performed in CF versus healthy monocytes triggered by 1-minute 50 nM N-formylmethionyl-leucyl-phenylalanine (fMLP) stimulation. Percentage variation relative to resting cells is shown. *P < 0.01 by Student’s t test (n = 3; mean ± SD). (B) Representative experiment summarized in fluorescence intensity histograms of RhoA-GTP and CDC42-GTP staining of monocytes from healthy donors and patients with CF. The results are presented as histograms of fluorescence intensity in log scale. Dashed lines indicate the reference values of isotype control antibodies.
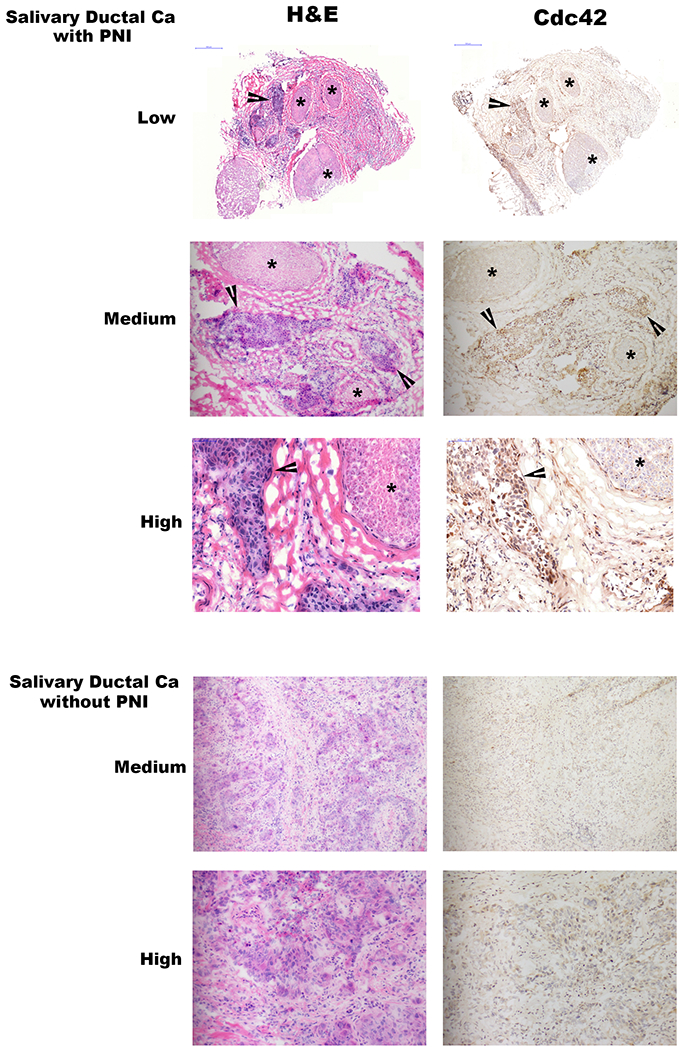
GTP-Cdc42 expression in human neuroinvasive carcinomas.
Low (20x), medium (100x), and high (200x) power magnification hematoxylin and eosin (H&E) and GTP-Cdc42 immunohistochemistry (IHC) staining of two different human salivary ductal carcinoma specimens, one with and one without perineural invasion. Asterisks indicate nerve fascicles, while arrowheads indicate sites of carcinoma. Photomicrographs demonstrate active Cdc42 in cancer cells that are invading nerves, but diminished Cdc42 expression in cancer cells lacking perineural invasion.
Immunofluorescence and phalloidin staining
Cells were plated on glass bottom 96-well plates and grown for 24 hours before treatment with G2 (50 μM) or DMSO (vehicle control) for 8 hours. The cells were fixed in 4% PFA, permeabilized in TBS with 0.1% triton-X and blocked in TBS containing 10% goat serum, 1% BSA, and 0.1% triton-X (blocking buffer) for 1 hour. Primary antibodies against fascin (1:300 dilution) or GTP-Rac1 (1:300) were added to blocking buffer and incubated overnight at 4°C. The wells were washed with TBS containing 0.1% triton-x and incubated with secondary antibody mixture (anti-mouse fluorescently-labeled secondary). Actin was stained with Phalloidin-488 according to manufacturer instructions (Invitrogen, Carlsbad, CA). A nuclear counterstain was performed with Hoechst. Imaging was performed using a Nikon Ti2 Eclipse fully-automated inverted fluorescence microscope.
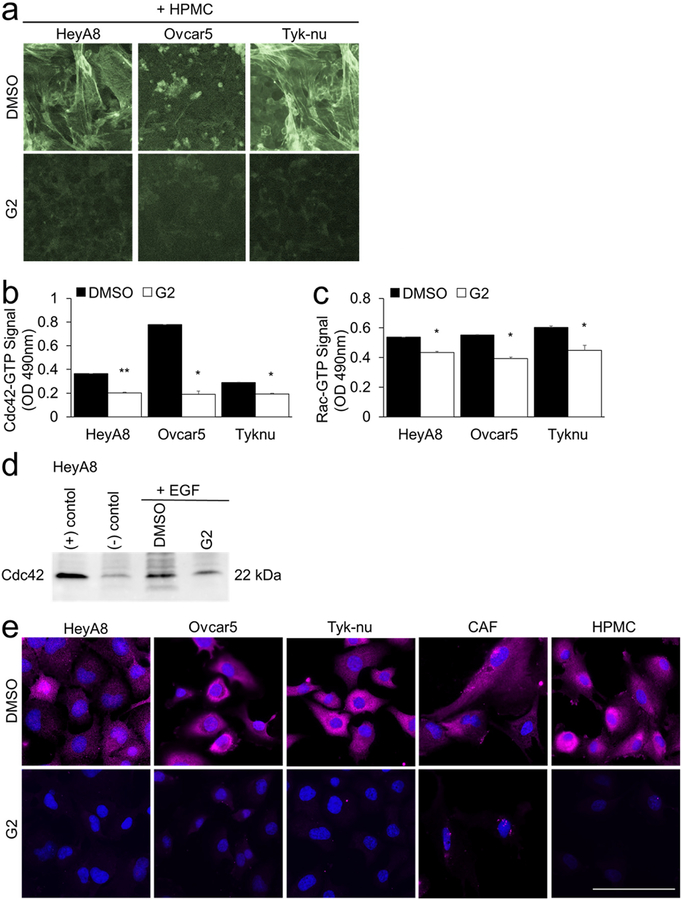
a. F-actin (Phalloidin-488) and nuclear (Hoechst) staining of cancer cells and primary human mesothelial cells (HPMC) after 24 hour co-culture and subsequent 8 hours of treatment with 50 μM G2 or DMSO (vehicle control). b-e. Cancer cells were cultured on plastic. Twenty-four hours later the cancer cells were treated for 5 hours with 50 μM G2 or DMSO control in serum-free media followed by 10 minute treatment with 50 ng/ml epidermal growth factor (EGF). The levels of GTP-bound Cdc42 or Rac1 were measured using the following assays. b. Cdc42 G-LISA Activation Assay. c. Rac1,2,3 G-LISA Activation Assay. Bars represent mean ± standard error of the mean (n=5 wells per cell type; n=3 independent experiments). Differences between treatments were evaluated using a paired t-test, two-tailed, with p<0.05 (*) and p<0.01 (**).d. Cdc42 Pull-down Activation Assay. e. Immunofluorescent detection of Rac1-GTP (pink). Blue, nuclei. Size bar, 50μm.

Immunofluorescence staining.
Subconfluent cells grown on glass coverslips were fixed with 3.7% paraformaldehyde prepared in cytoskeletal buffer (32). The coverslips were washed in water and mounted on microscope slides with Fluoromount mounting medium (Clinisciences). Immunostaining for the detection of active Cdc42 was performed after an additional blocking step with iT reagent (Invitrogen) and prolonged incubation with the conformational anti-Cdc42-GTP antibodies. The coverslips were mounted with antifade reagent (Invitrogen).
Fgd1 and cortactin relocalize at the plasma membrane upon TGF-β stimulation.
(A) Cells were treated with TGF-β for increasing time periods, fixed, and analyzed by immunofluorescence for Fgd1 (Ab#2), Cdc42-GTP, cortactin, and F-actin. Representative confocal images show individual staining for Fgd1, Cdc42-GTP, cortactin, and F-actin (bar, 10 μm). A magnified view of the boxed zone in the F-actin image shows the merge image of Fgd1 (green) and Cdc42 (red) or Fgd1 (green) and cortactin (red) stainings and their colocalization (yellow). (B) Western blot analysis of BAE cells extracts after cell fractionation, showing cytosolic and membrane/cytoskeleton-bound Fgd1 or cortactin in the course of TGF-β stimulation without serum. The purity of the extracts was assessed by reprobing the membrane for tubulin (cytoplasmic extracts) and CD31 (membrane extracts). (C) BAE cells were stimulated with TGF-β for increasing periods of time, and cortactin was immunoprecipitated. Samples were analyzed by Western blotting for cortactin and Fgd1 content (Ab#1). Similar Fgd1 and cortactin levels seen in all lanes corresponding to cell lysates demonstrate equal protein loading. (D) Same experiments as in panel A performed with cells which had been depleted of Fgd1 or cortactin by transfection of siRNA Fgd1 #2 or cortactin siRNA and subsequently stimulated with TGF-β for 30 min (bar, 10 μm). A magnified view of the boxed zone in the merge image shows details of Fgd1 and cortactin stainings (yellow) (bar, 10 μm).
Immunofluorescence.
Rabbit tissue and T84 cell immunostaining was performed as we previously described (33). Briefly, for Cdc42-GTP immunostaining, 10-μm sections of frozen cecal tissues from rabbits infected with RDEC-H19A bacteria were fixed in 3% formaldehyde in PBS for 30 min, washed extensively in PBS, permeabilized with 0.1% saponin, and blocked with 2% BSA and 15% FBS for 45 min. Sections were incubated with primary antibodies at room temperature for 1 h, washed three times in PBS, and incubated with fluorescently labeled secondary antibodies phalloidin for F-actin and Hoechst for nuclear staining, for an additional 1 h, washed again, immersed in gel mount, and mounted on glass slides for confocal microscopy.
Detection of Stx2 binding sites in human colonic tissue was done as we described (27). Briefly, cryosections of normal human colonic tissue from six individuals were fixed, permeabilized, and blocked as described above. Sections were incubated with Stx2-Alexa568 and B-subunit of cholera toxin (CTB)-Alexa 488 and Hoechst for 1 h, washed again, immersed in gel mount, and covered with coverslips for confocal microscopy.
For cell immunofluorescence experiments, confluent T84 monolayers grown on filters were fixed with 3% formaldehyde in PBS for 10 min, washed extensively in PBS, permeabilized as described above for 30 min, and then incubated with primary and fluorescently labeled secondary antibodies, rinsed, and mounted as described above.
Fluorescence confocal imaging of tissue and cells was performed using Zeiss 510 LSM. Eight- or twelve-bit fluorescence images of confocal optical 0.4-μm sections were collected for further qualitative and quantitative analysis using MetaMorph software (Roper Industries, Marlow, UK).
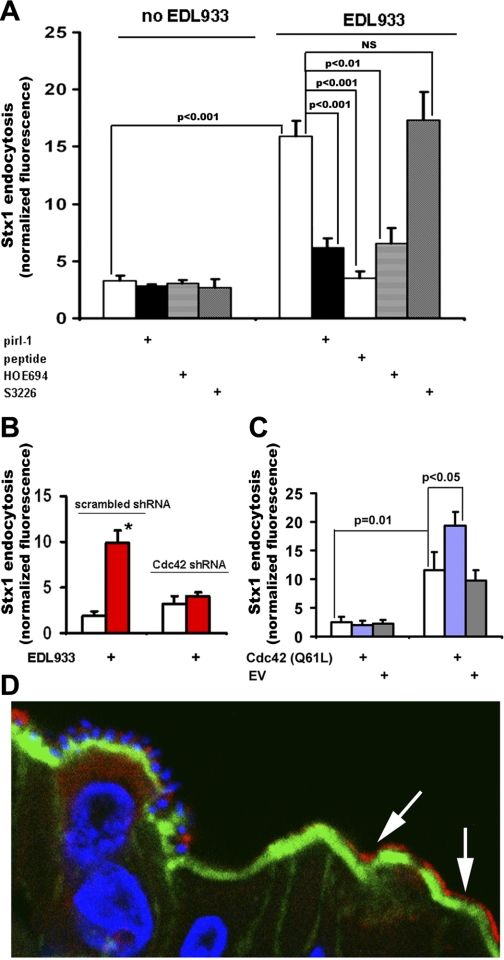
Cdc42 is necessary for EHEC-induced MPC in vitro and in vivo. A: …… C: constitutively active Cdc42 enhances the EHEC effect on Stx1 endocytosis but is not sufficient to stimulate MPC itself. EV, empty vector; n ≥ 3 for each condition. D: Cdc42 was active (red by anti-Cdc42-GTP Abs, with secondary AlexaFluor 568) in subset of rabbit cecal epithelial cells that often did not have attached bacteria; attached RDEC-H19A bacteria and T84 cell nuclei, blue by Hoechst (33); apical F-actin, green by phalloidin-AlexaFluor 488.
Immunostaining and fluorescence microscopy
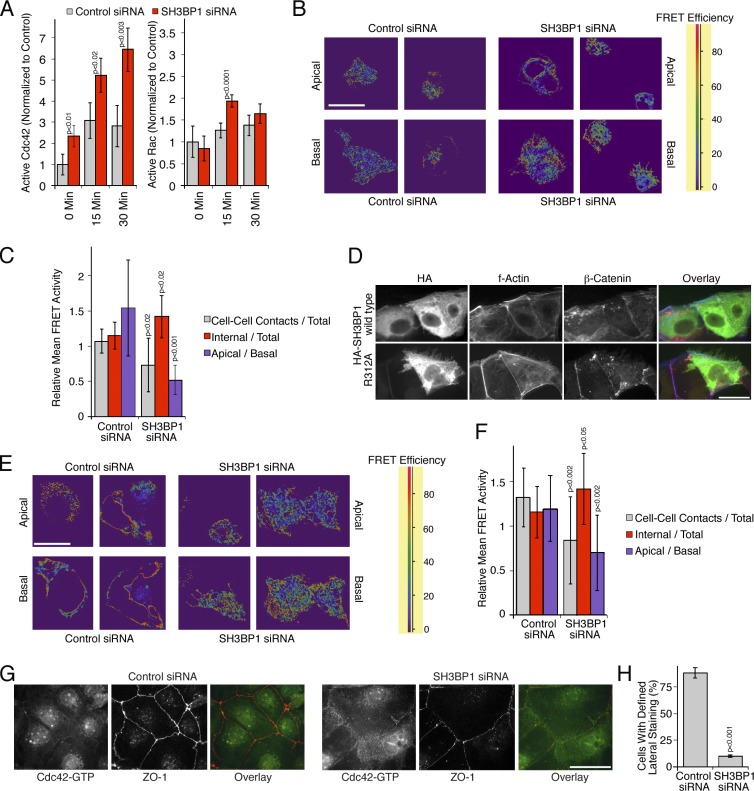
Cells were either fixed with methanol (5 min at −20°C) followed by rehydration in PBS at ambient temperature or with 3% PFA in PBS for 20 min at ambient temperature. PFA-fixed cells were then permeabilized with 0.3% Triton X-100 in PBS containing 0.5% BSA and 20 mM glycine for 3 min followed by two washes with blocking buffer (PBS with 0.5% BSA and 20 mM glycine; Balda et al., 1996). The samples were then incubated for 1 h in blocking buffer. After blocking and incubation with primary antibodies, which were diluted in blocking buffer, the samples were incubated with appropriate fluorescent cross-absorbed and affinity-purified secondary antibodies conjugated to Alexa 488, Cy3, Cy5, or Alexa 647 (Jackson ImmunoResearch Laboratories, Inc.) in blocking buffer. In some experiments, we used fluorescent phalloidin (Alexa 647; Molecular Probes) and Hoechst 33258 to label DNA (Invitrogen). 5-µm sections of mouse tissues were obtained and stained as described previously (Elbediwy et al., 2012; colon and small intestine sections were provided by P. Clark, Imperial College London, London, UK). All samples were embedded in ProLong Gold antifade reagent (Life Technologies). Epifluorescent images were collected with a DMIRB fluorescent microscope (Leica) using a Apochromat 63×/1.4 oil immersion objective fitted with a camera (C4742-95; Hamamatsu Photonics) and simple PCI software. Confocal images were acquired with an LSM 700 confocal laser scanning microscope (Leica) or an SP2 confocal microscope (Leica) using Apochromat 63×/1.4 immersion oil objectives. 518F immersion oil (Carl Zeiss) was used for all objectives. Images were acquired at ambient temperature using ZEN 2009 or Leica LCS, respectively. Images were adjusted for brightness and contrast with Adobe Photoshop. For FRET experiments, siRNA-transfected cells were plated into ibidi 8-well chamber slides and transfected with pRaichu-Cdc42 as previously described (Yoshizaki et al., 2003; Terry et al., 2011). The samples were analyzed using an SP2 microscope (Apochromat 63×/1.4 objective, 37°C) and LCS FRET software (Leica) using the donor recovery after acceptor bleaching protocol and generating the shown FRET efficiency maps according to the equation [(Dpost − Dpre)/Dpost] × 100 (D represents donor intensity). For quantification of relative FRET values, CFP images were subtracted and mean FRET intensities were quantified with ImageJ. For each image, all cell–cell contacts were quantified and normalizations were performed by dividing mean values obtained for specific fields by the mean values obtained for the entire field imaged (Elbediwy et al., 2012). For structured illumination super-resolution microscopy, the samples were prepared as for standard immunofluorescence using secondary antibody pairs conjugated to Alexa 488 and Cy3. The samples were then imaged with a microscope (N-SIM; Nikon) using the 3D-SIM mode and an Apochromat 60×/1.2 lens. The Nikon software was used for 3D reconstructions and brightness adjustments. Images were quantified using the measurement tools in Adobe Photoshop and ImageJ. For the analysis of single cells, at least 50 cells were analyzed for each condition in each experiment. Cell height was measured at at least four sites per cell that were placed at regular intervals along the entire width of the cells, and the mean value was then calculated for each cell. Similarly, cell diameters were measured parallel to the longest axis at at least four sites and averaged for each cell analyzed. Planar cell areas (e.g., the area covered in xy planes) were measured at the level of the apical junctional complex by tracing the cell perimeter. To quantify the fluorescence intensity (e.g., F-actin and DPPIV), the relevant areas (e.g., the apical membrane) were traced and the integrated density was calculated.
Immunostaining and microscopy
Fixation with methanol or 3% PFA and permeabilization of cells were performed as previously described (Balda et al., 1996; Matter and Balda, 2003a). For the antibodies against active Cdc42 and Rac1 (NewEast Biosciences), cells were fixed in 3% PFA for 20 min at room temperature or methanol for 5 min at −20°C followed by a 3-min incubation in 0.3% Triton X-100 in blocking buffer (PBS containing 0.5% BSA, 10 mM glycine, and 0.1% sodium azide). The samples were then washed and incubated for 1 h in blocking buffer. After blocking and incubation with primary antibodies, the samples were incubated with the appropriate fluorescent secondary antibodies conjugated to either FITC, Cy3, or Cy5 (Jackson ImmunoResearch Laboratories, Inc.) in blocking buffer. In some experiments, fluorescent phalloidin was used (FITC and TRITC [Sigma-Aldrich]; Alexa Fluor 647 [Molecular Probes]), and Hoechst 33258 was used to label DNA (Invitrogen). Matrigel-grown samples were fixed with PFA and then incubated with blocking buffer containing 0.5% Triton X-100 and 0.1% SDS for 1 h. Antibody incubations were then also performed with the same detergent-containing blocking buffer. For tissue sections, colons were dissected from adult female MF1 mice that had been transcardially perfused with 4% PFA in PBS, in accordance with UK Home Office regulations, embedded in OCT compound (VWR International) and snap frozen. 5-µm sections were then taken using a cryostat. For immunofluorescence staining, the sections were permeabilized with acetone/methanol (33:67) for 10 min at −20°C and then transferred to methanol/DMSO (4:1) for 20 h at 4°C. The samples were then rehydrated with sequential changes of methanol decreasing from 75 to 50 and 25 to 0% in PBS at room temperature for 5–10 min each. Next, the samples were further permeabilized and blocked for 8–10 h at room temperature in a humidified chamber in BSA permeabilization buffer (3% BSA, 1% Triton X-100, 0.5% Na-deoxycholate, 0.2% Na-dodecylsulfate, 150 mM NaCl, and 10 mM Hepes, pH 7.4) containing 5% donkey serum (Sigma-Aldrich). The samples were then incubated with goat anti-SH3BP1 and rabbit anti–ZO-1 for 16 h at room temperature in BSA permeabilization buffer containing 5% donkey serum in a humidified chamber. Afterward, samples were washed with PBS and BSA permeabilization buffer sequentially for 10–15 min in two cycles. Incubation with fluorescently labeled secondary antibodies and Hoechst 33258 in BSA permeabilization buffer was for 6 h at room temperature in BSA permeabilization buffer in a humidified chamber followed by washing with PBS and BSA permeabilization buffer for 10–15 min in two cycles and mounting with ProLong (Life Technologies). All fixed samples were embedded in ProLong Gold antifade reagent. All epifluorescent images of fixed specimens were acquired with a fluorescent microscope (DM IRB; Leica) using a 63×/1.4 NA oil immersion objective fitted with a camera (C4742-95; Hamamatsu Photonics) and simplePCI software (Hamamatsu Photonics).
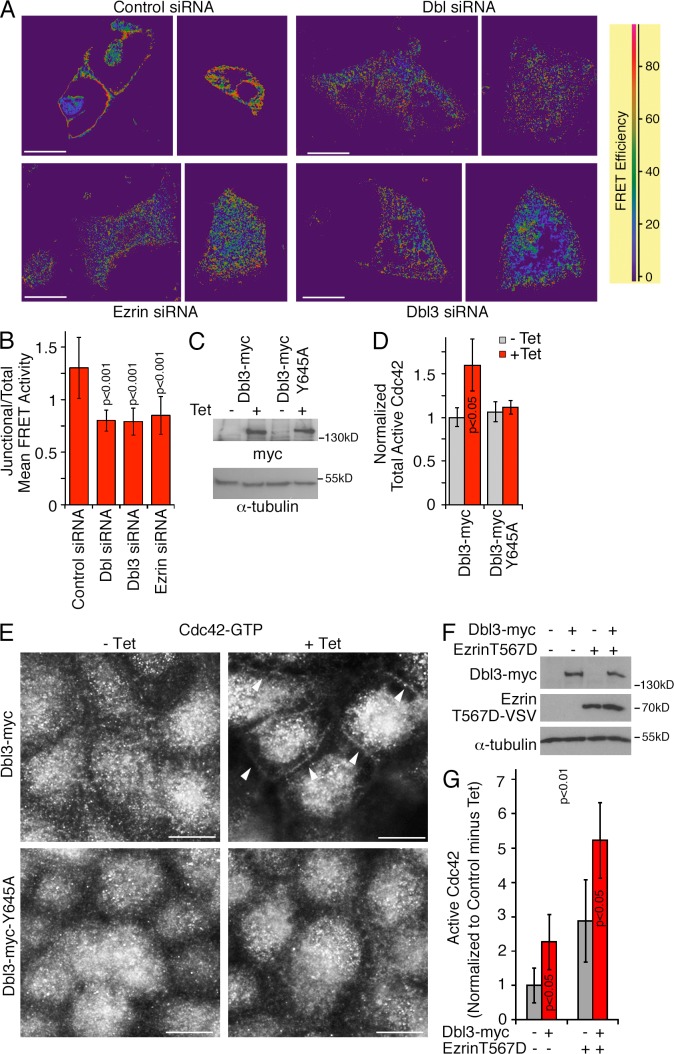
Spatial regulation of Cdc42 activity by SH3BP1.
…. (G and H) Caco-2 cells were transfected with siRNAs and then analyzed by immunofluorescence using antibodies against GTP-bound Cdc42 and ZO-1. H shows a quantification of the number of cells with a defined lateral Cdc42 staining as opposed to the diffuse lateral staining observed in SH3BP1-depleted cells. Shown are means ± 1 SD from six different fields (n = 6). Bars, 10 µm.
Cell immunofluorescence staining
Cells were seeded on fibronectin (20 µg/ml)-coating, glass-bottom dishes and cultured overnight. Samples were fixed by 4% paraformaldehyde in PBS for 20 min in room temperature, and permeabilized by 0.5% Triton X-100 in PBS for 5 min. After samples were blocked with 5% BSA in PBS for 1 hour, samples were stained with primary antibody active-Cdc42-GTP (New East Biosciences; 1:100 dilution) for 3 hours, and then subjected to Alexa Fluor 488-conjugated anti-mouse IgG (Invitrogen; 1:1000 dilution) for 1 hour at room temperature. Actin and nuclear were stained by Alexa Fluor 568-phalloidin (Sigma-Aldrich; 1:40 dilution) and Hoechst 33342 (Sigma-Aldrich; 1:100 dilution).
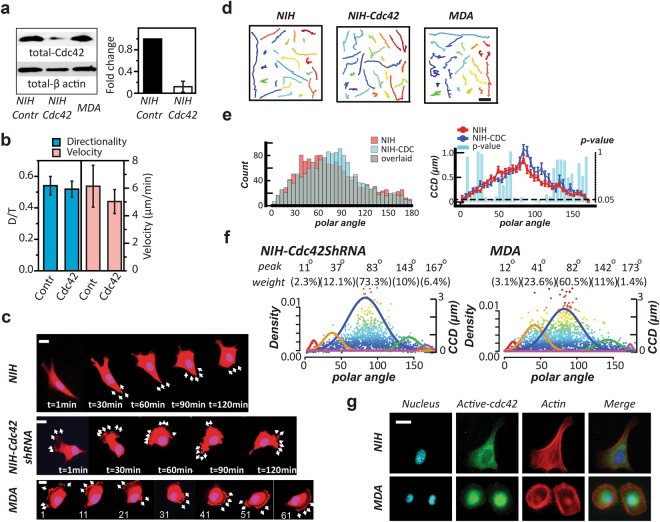
The CN correlation approach reflects the cell polarity changes.
(a) Western blot exhibits the total amount of Cdc42 in NIH 3T3 fibroblast (NIH), NIH with Cdc42 knockdown, and MDA-MB-231 (MDA), from left to right, respectively (left). The q-PCR results show a significant decrease of fold change (normalized by GAPDH) in the Cdc42 mRNA amount in the NIH 3T3 fibroblasts after Cdc42 knockdown (right). Error bars represent the SEM. The full-length blots are presented in the Supplementary Figure S4. (b) The directionality (D/T) and velocity of the NIH control group and the NIH with Cdc42-knockdown group. (c) Time-lapse images display the migration pattern of a prototypical NIH 3T3 cells (NIH), MDA-MB-231 cells (MDA), and the NIH 3T3 cells with Cdc42-knockdown (NIH-Cdc42shRNA). Scale bar: 20 μm. (d) From the left to the right, the trajectories of NIH, MDA, and NIH-Cdc42shRNA, respectively. Scale bar: 20 μm. (e) The overlaid occurrence diagrams (left) and the overlaid <CCD> diagrams (right) of the NIH and the Cdc42-knockdown counterparts (NIH-CDC). In the <CCD> diagrams, each bar shows the Lepage test result of the CCD distributions in the designated 5° polar-angle zone. The dash line: p-value = 0.05. (f) The NIH with Cdc42 knockdown and MDA possess similar signature angles, analyzed by UNM. We use the Signature Plot to express the results, where the top two rows show the signature angles and the weighing percentages of the corresponding signature curve, the solid color normal distribution curves outline the individual profiling subcellular migratory activities with the left Y-axis labeling the occurrence rate, and the dots are the individual CN correlation data with the right Y-axis labeling the CCD value. (g) Fluorescent images display the distribution of active Cdc42 in the NIH and MDA cells. Scale bar: 20 μm.