


Published Pictures for 26910 Rheb-GTP mAb
Measurement of Rheb Activation in Cultured NRK-49F Cells
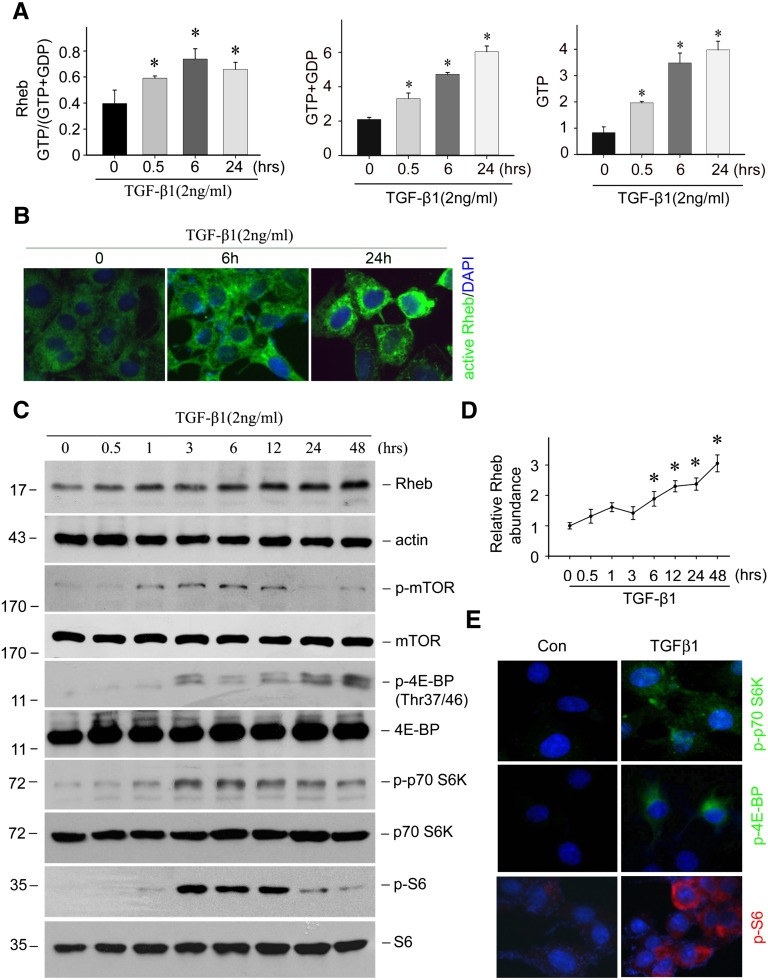
The active GTP-bound Rheb in cultured NRK-49F cells was determined as previously reported.58,59 Briefly, NRK-49F cells were treated with TGFβ1 (2 ng/ml) for the different time points as indicated. Cells were harvested and extracted in an ice-cold HEPES-based buffer containing 10 mM MgCl2, protease inhibitors, and 1% Nonidet P-40. The total Rheb in the extraction was precipitated with the anti-Rheb antibody. After shaking for 16 hours at 4°C, the beads were washed four times with lysis buffer and twice in 20 mM TrisPO4, 5 mM Mg2SO4. The beads were resuspended in 20 mM TrisPO4, 1 mM DTT, and 1 mM EDTA, and heated at 100°C for 3 minutes to elute GTP and GDP bound to the precipitated Rheb. GTP was converted to ATP by a nucleoside diphosphate kinase in the presence of excess ADP with the resulting ATP measured with the ATP Bioluminescent Assay Kit (product number: FL-AA; Sigma-Aldrich). The sum of GTP plus GDP was measured by converting GDP to GTP using pyruvate kinase and phosphoenolpyruvate and then the total GTP, which represents the sum of GDP plus GTP, was measured as described above. The result was presented as the ratio of GTP to GTP plus GDP.
Measurement of RheB-GTP levels after CD8+ T cell activation by flow cytometry
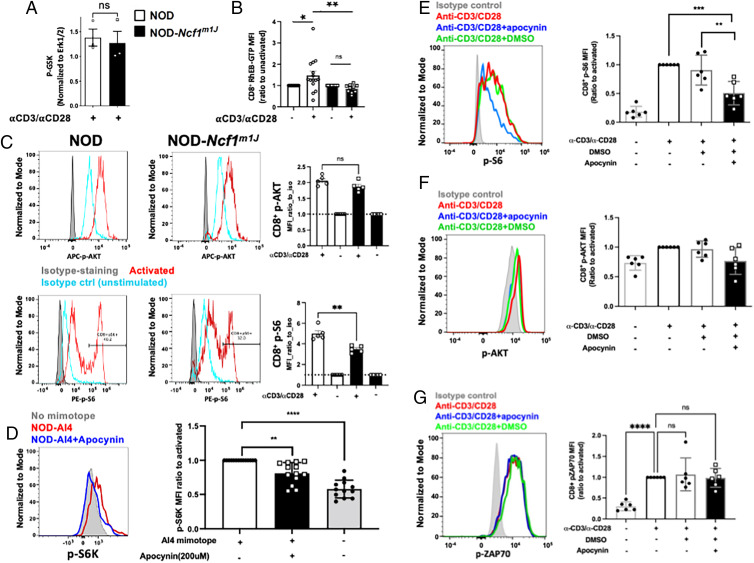
Anti-RheB-GTP was purchased from NewEast Biosciences (catalog no. 26910, clone 20D11D6) and conjugated using the Pacific Blue Ab Labeling Kit (P30013; Invitrogen). Splenocytes were isolated from NOD or NOD-Ncf1m1J mice and activated with soluble α-CD3/α-CD28 or treated with isotype Abs, as mentioned above, for 10 min, then fixed and stained with the LIVE/DEAD Fixable Yellow (LDY) Dead Cell Stain Kit (Invitrogen), permeabilized with prechilled 90% methanol, stained with conjugated Abs to RheB-GTP, CD3, CD8, pS6, p-ATK, and total RheB for analysis with a three-laser Cytek Aurora flow cytometer. RheB-GTP was analyzed in LDY−CD3+CD8+ population, expressed as the ratio of MFI of activated cells to that of isotype Ab-treated cells.
NOX2 activity is required for TSC1/2 repression and downstream mTORc1 activation during CD8+ T cell activation. (A) NOD or NOD-Ncf1m1J CD8+ T cells were activated by α-CD3/α-CD28 for 30 min and subjected to immunoprecipitation of p-GSK. Cellular p-GSK levels, a marker of Akt kinase activity, were determined relative to the input control Erk1/2. (B) NOD or NOD-Ncf1m1J splenocytes were activated by α-CD3/α-CD28 for 10 min and subjected to flow cytometry. Intracellular levels of RheB-GTP were determined by staining with Abs and analyzed in LDY−CD3+CD8+ population. (C) Splenocytes from NOD (open bars) and NOD-Ncf1m1J (black bars) were stimulated with soluble α-CD3/α-CD28 or isotype hamster IgG controls for 30 min with protein G as a crosslinker. Surface T cell markers together with p-AKT and p-S6 were detected using flow cytometry. Representative histograms of NOD (left) and NOD-Ncf1m1J were shown, gated on Live/Dead_NIR−CD3+CD8+. Data are expressed as MFI ratio to isotype control (unstimulated, blue histogram); n = 5 each. (D) Intracellular staining and quantitative analysis of pS6K in autoreactive monoclonal AI4 CD8+ T cells after stimulation by specific mimotope for 30 min either without (open bars) or with (black bars) apocynin (200 μM). Gated on Live/Dead_NIR−CD3+CD8+. (E–G) Human PBMCs from healthy donors (n = 6) with or without pretreatment of apocynin (400 µM) were activated with α-CD3/α-CD28 for 10 min. Surface markers and intracellular p-S6, p-AKT, and p-ZAP70 were stained with fluorescent Abs and detected using a flow cytometer. Shown are p-S6 (E), p-AKT (F), and p-ZAP70 (G) MFI ratio to activated (the second group), gated on Live/Dead-Yellow−CD3+CD8+ T cells.
Rheb GTPase and Syngap1 GAP activity assays
Rheb GTPase assay and Syngap1 GAP activity assays were performed according to the GTPase-Glo™ Assay manufacturer’s instructions (Promega, V7681). Recombinant Rheb protein (0–2.5 μg, Abcam, ab78768) was used in reactions containing 10 µM GTP in GTPase/GAP buffer and 1 mM DTT. Reactions were incubated for 90 min at room temperature. For the Syngap1 GAP activity assay, immunoprecipitated Syngap1 from HEK-293H cells transfected with empty vector, WT, S788D or S788A Syngap1 was added to a Rheb GTPase reaction in GTPase/GAP buffer containing 10 µM GTP and 1 μg Rheb (Abcam, ab78768). GTPase reactions for Syngap1 GAP activity were incubated for 2 h. For both assays, GTPase-Glo™ Reagent was then added. After a further incubation of 30 min at room temperature Detection Reagent was added and luminescence was recorded on a PerkinElmer LS55 luminometer. Luminescence is measured as relative light units and corresponds to residual GTP amount after the GTPase reaction.
Active Rheb (Rheb-GTP) immunoprecipitation assay
Rheb-GTP was detected with immunoblotting using the Rheb Pull-Down Activation Assay Kit (New East Biosciences, 81201). Transfected HEK-293H cells were washed thrice with PBS and lysed in glass Dounce homogenizers. Lysates were left on ice for 15 min with occasional vortexing and then centrifuged at 4°C at 16, 000 g for 20 min. A total of 1 mg of the supernatant was used to immunoprecipitate active-Rheb, to which 1 µg anti-Rheb-GTP antibody (New East Biosciences, Cat. No. 26910) and 20 µl of A/G agarose bead slurry (New East Biosciences, Cat. No. 30301) were added. Samples were incubated for 1 h at 4°C with gentle agitation. Beads were collected through centrifugation at 5000 g for 1 min, washed thrice with Assay/Lysis Buffer (New East Biosciences) and resuspended in SDS-PAGE buffer for immunoblotting.
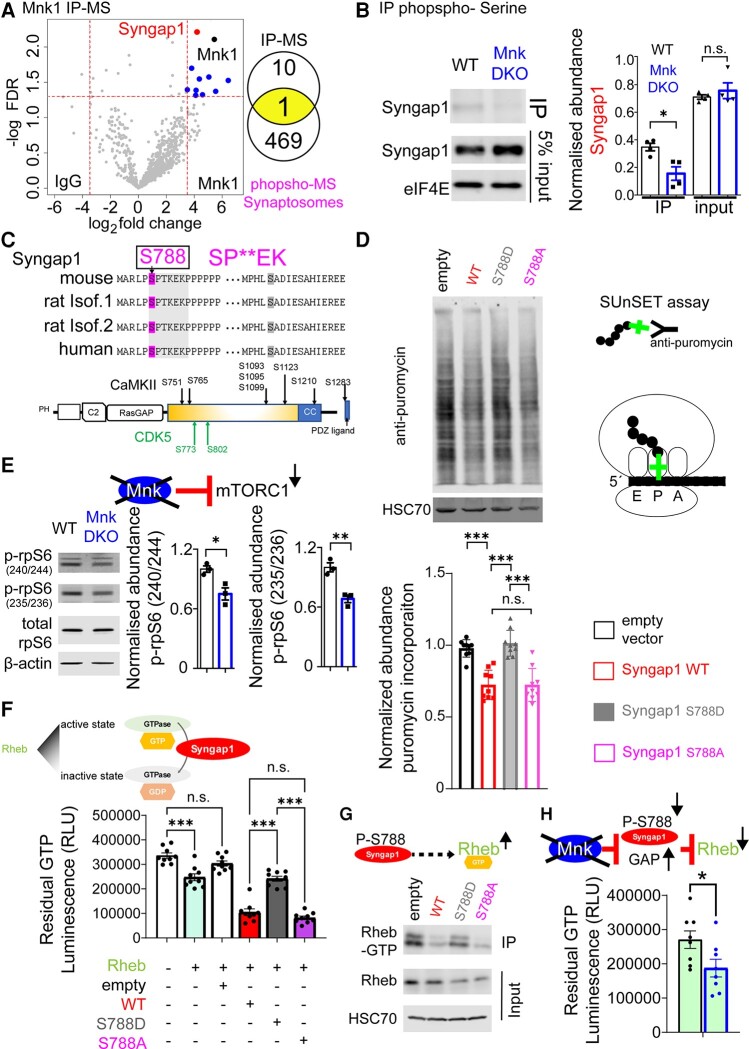
Mnk1 binds to and phosphorylates Syngap1.
(A) Identification of Mnk1 protein interactome in whole brain by co-immunoprecipitation–mass spectrometry (IP-MS). Volcano plot shows proteins co-enriched with Mnk1 using anti-Mnk1 antibody (over IgG). A cut-off of ± 3.5 log2 fold-change (dashed vertical lines) and FDR < 0.05 (dashed horizontal line) was applied. Venn diagram demonstrates the overlap between proteins co-enriched with Mnk1 and the proteins with reduced phosphosites in Mnk DKO synaptosomes. (B) Analysis of Syngap1 phosphorylation in WT and Mnk DKO whole brains. Proteins with phospho-Ser residues were immunoprecipitated by specific anti-phospho-serine antibody and the presence of Syngap1 was measured by western blot. The bar graph represents the relative enrichment of Syngap1 protein in each genotype in the input and phospho-Ser-enriched fractions. n = 4 for each genotype; Student’s t-test, *P < 0.05. (C) Top: Conservation of the two observed Mnk-sensitive phosphosites and the presence of the predicted enriched motif (Fig. 3B and F) on Syngap1 in the indicated species. Bottom: Schematic of known domains of rat Syngap1 protein, positions of the validated and predicted phosphosites, and validated phosphorylation sites mediated by CDK5 and CamKIIα. (D) Puromycin incorporation assay in HEK-293H cells transfected with wild-type or phospho-mutant (S788A) or phospho-mimetic (S788D) Syngap1. Representative immunoblot analysis of lysates probed with antisera against the indicated proteins; HSC70 is the loading control (n = 3 for each group). One-way ANOVA with Tukey’s post hoc test, *P < 0.05. (E) mTORC1 activity in synaptosomes from Mnk DKO mouse brain. Left: Representative images from immunoblotting of synaptosome lysates probed with antisera against the indicated proteins; β-actin is the loading control. Right: Quantification of relative protein expression in immunoblotting experiment. Normalized expression of two phosphosites on rpS6 (240/244, 235/236) is depicted; n = 3 for each genotype. (F) Luminescence-based Syngap1 GAP activity assay for recombinant Rheb using Syngap1 mutants; one-way ANOVA with Bonferroni’s post hoc test, ***P < 0.001. (G) Active Rheb (Rheb-GTP) immunoprecipitation-based assay. Syngap1 WT, mutants or empty vector groups were probed with antisera against the indicated proteins using immunoprecipitation and total lysates; HSC70: loading control. (H) Luminescence-based Syngap1 GAP activity assay (from immunoprecipitated Syngap1) in brain synaptosomes. Residual GTP (indicative of GTP hydrolysis) for wild-type and Mnk DKO synaptosomes.
4.8. Rheb-GTP-Binding Assays
Cells were harvested with an ice-cold lysis buffer (50 mM Tris (pH 8.0), 150 mM NaCl, 10 mM MgCl2, 1 mM EDTA, and 1% Triton-X100). The lysates were centrifuged at 12,000× g at 4 °C for 10 min before the supernatants were collected for RHEB-GTP immunoprecipitation following the manufacturer’s protocol (New East Biosciences, King of Prussia, PA, USA, #26910) with protein-L agarose beads (Santa Cruz Biotechnology, Santa Cruz, CA, USA, #sc-2336). Briefly, protein-L agarose beads were previously blocked with 5% BSA diluted in a lysis buffer and incubated with equalized protein extracts at 4 °C with end-over-end rotation for 4 h. The beads were washed 3 times with the lysis buffer and eluted, denatured, and boiled in 2X Laemmli buffer. Western blotting was performed against total Rheb E1G1R (Cell Signaling Technology, Danvers, MA, USA, #13879).
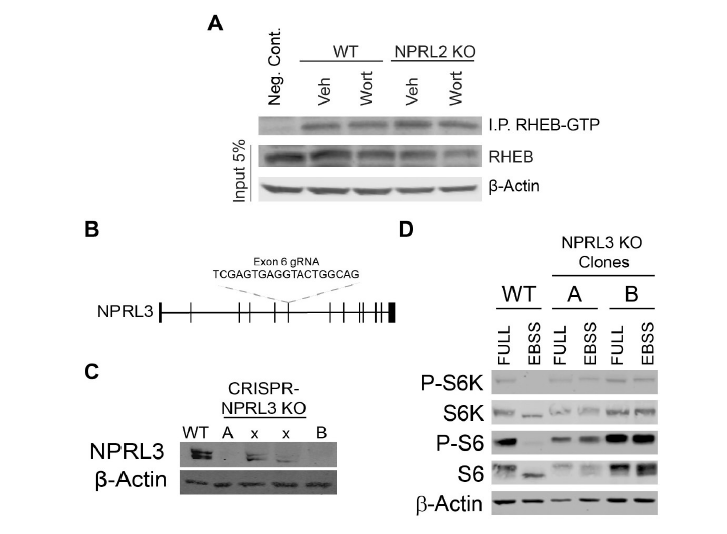
(A) GTP-binding state of RHEB from WT and NPRL2 KO cells treated with wortmannin
for 1 hour. Immunoprecipitation was performed using antibodies targeting the RHEB-GTP before
western blotting against RHEB-GTP, total RHEB and β-actin. Negative control lane did not include
RHEB-GTP antibody in the precipitation reaction. (B) CRISPR-mediate NPRL3 knockout targeting
scheme. (C) NPRL3 western blot analysis from WT and NPRL3 KO cell lines. (D) EBSS treatment of
WT or NPRL3 KO cell-lines were cultured in either complete media or EBSS for 1 hour.
Cell lysis, immunoprecipitation, and immunoblotting
For regular total cell lysis, cells were washed three times with cold PBS and lysed in Triton-X 100 lysis buffer containing 20 mM Tris-HCl [pH 7.5], 1% Triton X-100, 150 mM NaCl, 10 mM EDTA, 1% Na-deoxycholate, 50 mM NaF, 0.5 mM Na-orthovanadate, protease inhibitor cocktail (Sigma-Aldrich) and PhosSTOP protease inhibitor (Roche). For immunoprecipitation, cell lysates were precipitated with the indicated antibodies and protein G-Sepharose beads (GE Healthcare), and then washed with Triton-X 100 lysis buffer. Immunocomplexes were then subjected to SDS-PAGE and Western blotting. ImageJ software (Wayne Rasband, NIH) was used to quantify band intensities on the blots.
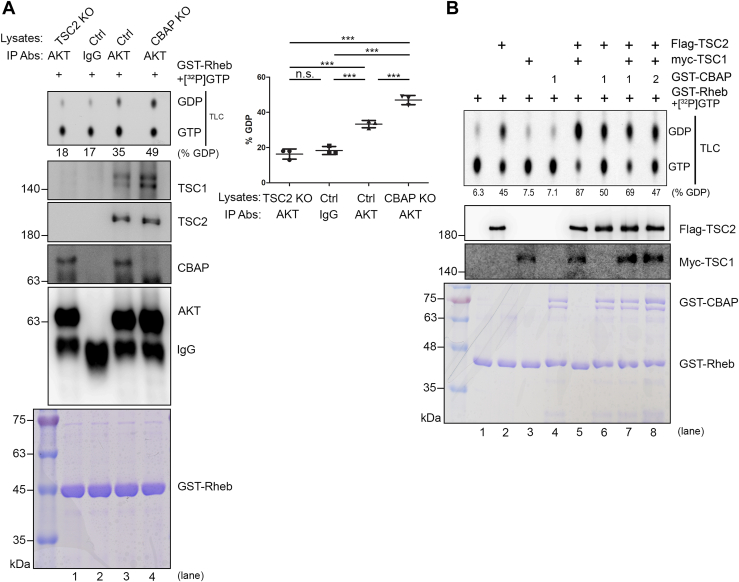
CBAP decreases the GAP activity in anti-Akt targeted TSC1/2 population.
A, increased TSC2 GAP activity of Akt immunocomplexes in CBAP-KO Jurkat cells using thin layer chromatography (TLC) method. Total Jurkat cell lysates (TSC2-KO, Ctrl and CBAP-KO) were immunoprecipitated with anti-pan-Akt antibodies, or a control IgG antibody, before being subjected to a TSC2 GAP assay using recombinant GST-Rheb preloaded with [α-32P]-radiolabeled GTP. The radioactivity of each spot was measured and the percentage GTP-to-GDP conversion was calculated. Protein levels of TSC1, TSC2, CBAP and Akt in each immunoprecipitate were monitored by Western blotting. Coomassie blue staining showed equal loading of the GST-Rheb recombinant proteins in each reaction. One representative data from three independent experiments was shown. Quantified GTP-GDP conversion rates were shown in the right part of the panel. One-way ANOVA was used to calculate statistical significance; ns, nonsignificant; n.s., none significant; ∗∗∗p < 0.001. B, dose-dependent suppression of TSC2 GAP activity by CBAP using in vitro translated recombinant TSC1/TSC2 complexes. IVT-synthesized Flag-TSC2 and myc-TSC1 were immunoprecipitated with tag-specific antibodies, and then subjected to an in vitro TSC2 GAP assay in the absence or presence of different amounts of recombinant GST-CBAP. Rheb-bound GTP and GDP were resolved by TLC. The percentage GTP-to-GDP conversion is indicated below the lanes. Each lane of reaction was also subjected to SDS-page analysis and probed with the indicated antibodies. Coomassie blue staining showed equal loading of GST-Rheb and various amounts of GST-CBAP proteins.
Cell lysis, immunoprecipitation, and immunoblotting
For regular total cell lysis, cells were washed three times with cold PBS and lysed in Triton-X 100 lysis buffer containing 20 mM Tris-HCl [pH 7.5], 1% Triton X-100, 150 mM NaCl, 10 mM EDTA, 1% Na-deoxycholate, 50 mM NaF, 0.5 mM Na-orthovanadate, protease inhibitor cocktail (Sigma-Aldrich) and PhosSTOP protease inhibitor (Roche). For immunoprecipitation, cell lysates were precipitated with the indicated antibodies and protein G-Sepharose beads (GE Healthcare), and then washed with Triton-X 100 lysis buffer. Immunocomplexes were then subjected to SDS-PAGE and Western blotting. ImageJ software (Wayne Rasband, NIH) was used to quantify band intensities on the blots.
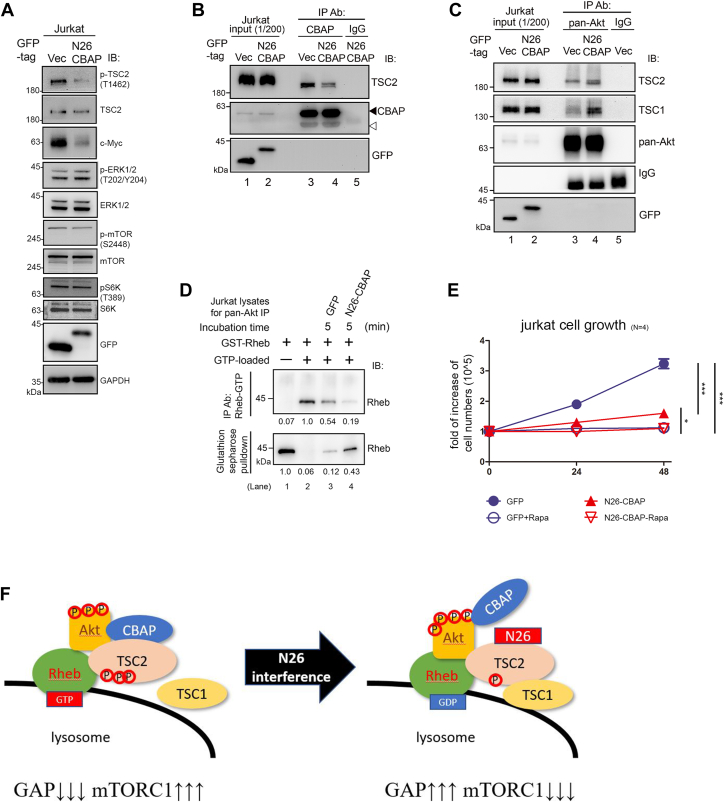
Interference of CBAP and TSC2 interaction impairs tumor cell growth.
A–C, N26 efficiently inhibits mTORC1 signaling in Jurkat cells by interfering with the CBAP and TSC2 interaction. Lysates of GFP-N26-CBAP-expressing cells were subjected to immunoblotting (A) or were immunoprecipitated with anti-CBAP antibody (B). C, expression of N26-CBAP increases the TSC1 within Akt immune complexes. GFP (+) vector (Vec) cells and GFP-N26-CBAP-expressing cells were both sorted by flowcytometry and subjected to immunoprecipitation with anti-pan-Akt antibody. The immunoprecipitates were subjected to analysis described in Figure 1 A. D and E, GFP-N26-CBAP increased the TSC2 GAP activity and inhibited Jurkat cell growth. Cell lysates of GFP(+) cells were used for In vitro GAP assays using non-isotope GTP-loaded GST-Rheb as substrates and anti-GTP-Rheb specific antibody to distinguish GTP-Rheb versus GDP-Rheb (D). Viable cell numbers in the GFP (+) population with or without rapamycin treatment were determined by trypan blue exclusion staining at indicated time points (E). One-way ANOVA was used to calculate statistical significance; ∗p < 0.05; ∗∗∗p < 0.001., n = 4. F, model of N26-CBAP interference of mTORC1 signaling in Jurkat cells via regulating stability of TSC1/2-Akt complexes. N26-CBAP perturbs CBAP-TSC2 interaction, leading to an increase of TSC1 binding to TSC2-Akt complex, increase of Rheb-GTP hydrolysis, and decrease of mTORC1 signaling.
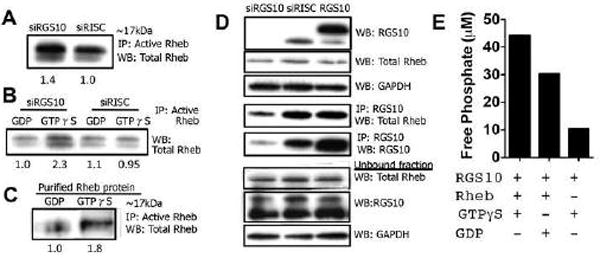
2.5 Rheb activation assay
SKOV-3 cells were plated in 10 cm dishes at a density of approximately 400,000 cells per dish and incubated overnight at 37°C. The cells were transfected with siRGS10, siRISC, pcDNA, and RGS10 plasmid, where indicated. After 48 h, the culture media was removed and cells were rinsed with ice-cold PBS. Then, 1 mL of ice-cold lysis buffer containing protease and phosphatase inhibitors was added to each dish. Plates were placed on ice for 10–20 min with agitation every 5 min. Lysates were cleared by centrifugation for 10 min at 12,000 × g at 4°C. The protein supernatant was collected and stored at −80°C until quantified by BCA assay. Next, 0.5–1 mL of cell lysate was aliquotted to microcentrifuge tubes and steps were performed according to the manufacturer’s protocol for the Rheb Activation Assay (NewEast Biosciences, Malvern, PA). Briefly, the assay utilizes anti-active Rheb mouse monoclonal antibodies (specifically recognizes Rheb-GTP from vertebrates) during the cell lysate incubation with gentle agitation. Thus, bound and active Rheb is pulled down by protein A/G agarose and precipitated active Rheb is detected using immunoblot analysis with anti-Rheb rabbit polyclonal antibody. For the GTPγS/GDP protein loading, 20 μl of 0.5 M EDTA (20 mM final concentration) was added to each microcentrifuge tube prior to the addition of 5 μl of 100 X GTPγS (positive control) or GDP (negative control) to the appropriate individual tubes, which were then incubated for 30 min at 30°C with agitation. Loading was stopped by putting tubes on ice and adding 32.5 μl of 1 M MgCl2. In a similar experiment, 1 μg of purified human full-length Rheb protein (Abcam, Cambridge, MA) was treated with GDP or GTPγS prior to immunoprecipitation with anti-active Rheb and immunoblotting with total Rheb. Following these procedures, electrophoresis was performed using approximately 20 μL/well of the pull-down supernatant loaded onto a polyacrylamide gel (17%) and protein bands were resolved by immunoblotting on a nitrocellulose membrane. Proteins were detected by ECL using SuperSignal West Pico Chemiluminescent Substrate. Results were repeated and observed three times.
Evaluation of the GAP activity of RGS10
(A) SKOV-3 cells were transfected with either siRISC or siRGS10 prior to immunoprecipitation with an active Rheb monoclonal antibody and immunoblotting with total Rheb rabbit polyclonal antibody. (B) In a separate experiment, cells were treated as indicated above, but GTPγS and GDP were added to the cell extracts in vitro and incubated for 30 min prior to the pull-down of active Rheb and blot for total Rheb (for details see Methods). (C) In the reciprocal experiment, purified, full-length Rheb protein was incubated with GTPγS or GDP prior to immunoprecipitation with active Rheb and immunoblot for total Rheb. (D) Cells were treated as previously described and also transiently transfected with an RGS10 expression vector prior to immunoprecipitation. Following transfection, cell extracts were probed for RGS10, total Rheb and Rheb. Other extracts were immunoprecipitated with anti-RGS10 goat polyclonal antibody and blotted with anti-total Rheb rabbit polyclonal antibody. Unbound fraction is also shown. (E) A non-radioactive method using a malachite green reagent kit was utilized to measure inorganic free phosphate in a cell-free, aqueous solution and assess the GAP activity of RGS10. Purified proteins RGS10 and Rheb were incubated in the presence of GTPγS or GDP, where indicated, for 120 min. When RGS10 induces the hydrolysis of GTP to GDP, free phosphate is released into the solution, which is detected by the formation of a green molybdophosphoric acid complex and measured in a 96-well plate using absorbance that is directly related to the free phosphate release (17).
Active Rheb.
Per the kit manufacturer’s specifications (New East Biosciences; cat. no. 81201), configuration-specific anti-Rheb-GTP monoclonal antibody was incubated with 250 μg of muscle cytosolic lysates (CHAPS buffer described previously; 1,000 g). As a negative and a positive control in vitro, GDP and GTPγS loading of Rheb, respectively, was performed on fasted muscle lysates and included in the immunoprecipitation. The bound active Rheb was immunoprecipitated by protein A/G agarose (4°C, 1 h), then pelleted and washed three times in CHAPS buffer. After the final wash, the pellet was resuspended in 2X SDS-sample buffer and boiled. The precipitated active Rheb was detected by Western immunoblot analysis (described above) using anti-Rheb rabbit polyclonal antibody provided in the kit to measure the active Rheb-GTP levels.
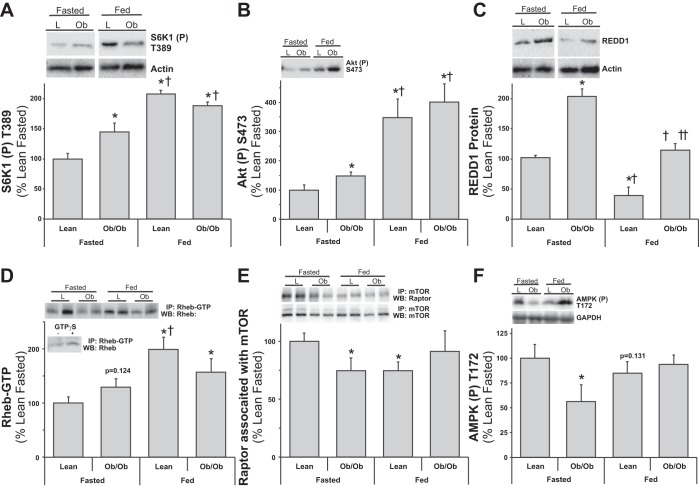
Lean and obese mouse muscle mTOR signaling responses to fasting and feeding. Equal protein from fasted and fed, lean (L) and ob/ob (Ob) male mice plantar flexor complex muscle homogenates were analyzed by Western blot analysis. A: phospho-S6K1 T389 and actin, then normalized to actin. B: phospho-Akt S473 and actin, then normalized to actin. C: REDD1 and actin, then normalized to actin. D: Rheb-GTP from active-Rheb immunoprecipitates. Inset: negative and positive controls from Rheb-GTP. E: raptor and mTOR from mTOR coimmunoprecipitations. F: phospho-AMPK T172. Representative Western blots are shown. Means marked with an * are significantly different, P < 0.05 vs. lean fasted; † are significantly different, P < 0.05 vs. ob/ob fasted; and †† are significantly different, P < 0.05 vs. lean fed (n = 5–8/group).
Measurement of Rheb GTP loading status
Rheb GTP loading was assessed as previously described (50) with the following modifications. HEK293 Tet-On HA-REDD1 cells were cultured in 10 cm dishes, transfected with pRK7-FLAG-Rheb (kindly provided by Dr. John Blenis, Harvard Medical School). Forty-eight h after transfection cells were placed in phosphate-free DMEM (Gibco) supplemented with 10% FBS for 90 min and treated with doxycycline to induce HA-REDD1. Cells were labeled with 25 μCi of [32P]phosphate/mL for 4 h. Cells were collected in lysis buffer (0.5% NP-30, 50 mM Tris pH 7.5, 100 mM NaCl, 10 mM MgCl2, 1 mM dithiothreitol, 1 mM benzamidine, 200 mM sodium vanadate, and 10 l/ml protease inhibitor mixture). FLAG-Rheb was immunoprecipitated with anti-FLAG M2 affinity gel and the Rheb-bound nucleotides were eluted with elution buffer (2 mM EDTA, 0.2% SDS, 1 mM GDP, 1 mM GTP) at 68°C. GTP and GDP were resolved by thin layer chromatography and visualized by a Typhoon 9400 Phosphorimager (GE Healthcare). Rheb-GTP loading was also assessed using a RheB Activation Assay Kit (NewEast Biosciences) according to the manufacturer’s instructions.
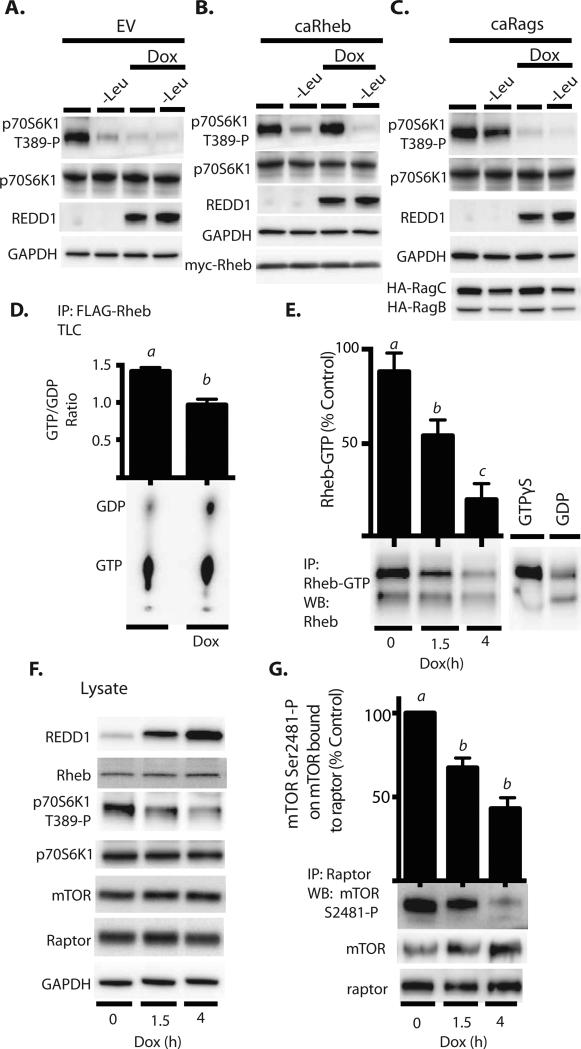
REDD1 expression attenuates Rheb-GTP loading and mTORC1 autophosphorylation
HEK293 Tet-On HA-REDD1 cells were transfected with either an empty vector control plasmid (EV) (A), a plasmid expressing constitutively active (caRheb) (B), or plasmids expressing caRags (C). REDD1 expression was induced with doxycycline (Dox) in cells maintained in either complete growth medium or medium lacking leucine (-Leu) as indicated in the figure. (D) Cells expressing FLAG-Rheb were labeled with [32P]phosphate, FLAG-Rheb was immunoprecipitated, and the amounts of GTP and GDP in the immunoprecipitate were determined by thin layer chromatography (TLC). (E) Rheb-GTP loading was also assessed by immunoprecipitation using an antibody that selectively recognizes Rheb-GTP. Samples incubated with GTPγS or GDP were used as positive and negative controls, respectively. (F) Western blot analysis of whole cell lysates after doxycycline administration. (G) Western blot analysis of autophosphorylation of mTOR on Ser2481 in raptor immunoprecipitates. Blots or phosphorimages shown in panels A-D and E-G are representative of results for two (N=2) or three experiments (N=3), respectively; within an experiment, three independent samples were analyzed. Results shown in (D), (E), and (G) represent means ± SEM.
Immunohistochemistry
Cells were fixed with 4% sucrose-containing PFA for 30 min then incubated in blocking solution (PBS with 0.1% Triton-X and 3% Donkey Serum) for 1 hour. For parallel comparisons cells were immunostained and imaged on the same day. Primary antibodies were added in blocking solution for 3 hours at room temperature or overnight at 4°C. Secondary antibodies were added in the blocking solution for 1 hour at room temperature. The following primary antibodies were used at 1∶1000 dilution: anti-MAP2 (Abcam), anti-GFP (NeuroMab), anti-Rheb (NewEast Biosciences), anti-Rheb-GTP (NewEast Biosciences), anti-P70S6K and anti-phospho-P70S6K (T-389)(Cell Signaling Technologies). Images for primary, secondary, or tertiary dendrites proximal to the cell body were selected randomly for analysis. Image J was used for analysis. For all immunofluorescence-based data ‘n’ represents the number of individual cells, combined data were generated from multiple cultures.
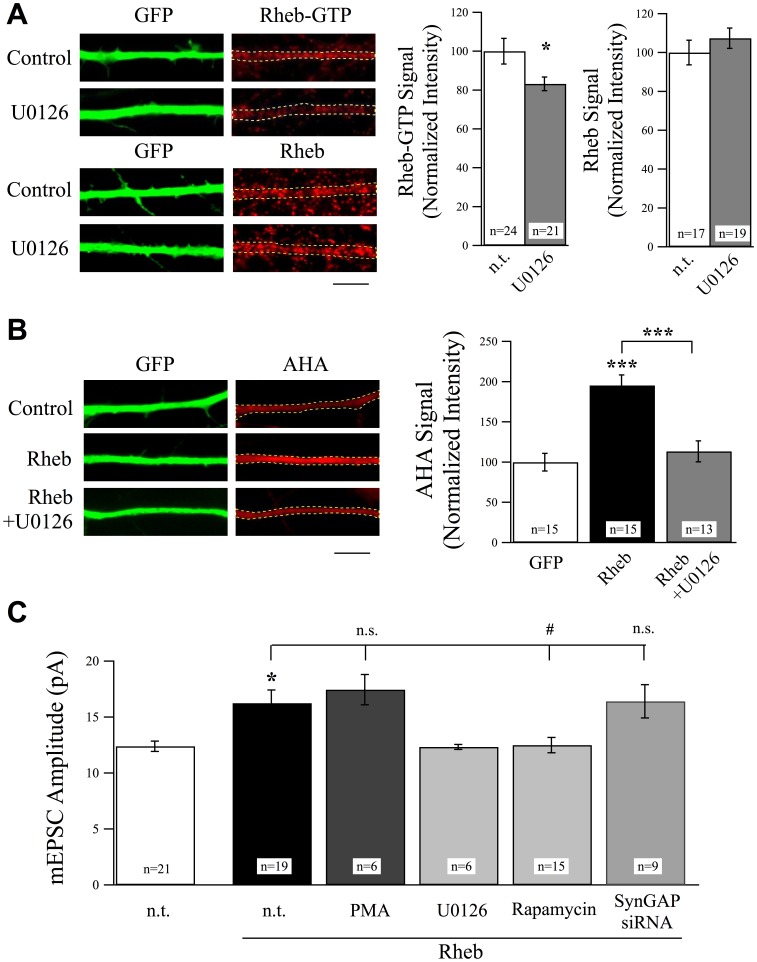
Rheb is a Downstream Effector of ERK and SynGAP Signaling to Regulate Excitatory Synaptic Strength.
(A) Representative images of neurons stained with anti-Rheb-GTP antibody or total Rheb antibody in the presence or absence of the ERK blocker U0126 (25 µM, 6 hr). U0126 significantly suppressed levels of active Rheb without changing total Rheb levels. Scale bar = 5 µm. (B) Example images and normalized AHA intensity values from experiments using FUNCAT to measure protein synthesis rates. Overexpression of Rheb in cortical neurons produced a significant increase in protein synthesis rates as evidenced by an increase in AHA-labeling rates. This increase in protein synthesis was suppressed by treatment with U0126 (25 µM, 6 hr). Scale bar = 5 µm. (C) Overexpression of Rheb increased mEPSC amplitudes and was recovered by the treatment with U0126 (25 µM, 6 hr) or rapamycin (1 µM, 6 hr). Treatment with PMA (1 µg/ml, 6 hr) did not cause a further increase in mEPSC amplitudes in Rheb overexpressing neurons. Co-expression of Rheb did not produce a further increase in AMPAR-mEPSCs in neurons expressing SynGAPsiRNA
Immunohistochemistry
Cells were fixed with 4% sucrose-containing PFA for 30 min then incubated in blocking solution (PBS with 0.1% Triton-X and 3% Donkey Serum) for 1 hour. For parallel comparisons cells were immunostained and imaged on the same day. Primary antibodies were added in blocking solution for 3 hours at room temperature or overnight at 4°C. Secondary antibodies were added in the blocking solution for 1 hour at room temperature. The following primary antibodies were used at 1∶1000 dilution: anti-MAP2 (Abcam), anti-GFP (NeuroMab), anti-Rheb (NewEast Biosciences), anti-Rheb-GTP (NewEast Biosciences), anti-P70S6K and anti-phospho-P70S6K (T-389)(Cell Signaling Technologies). Images for primary, secondary, or tertiary dendrites proximal to the cell body were selected randomly for analysis. Image J was used for analysis. For all immunofluorescence-based data ‘n’ represents the number of individual cells, combined data were generated from multiple cultures.
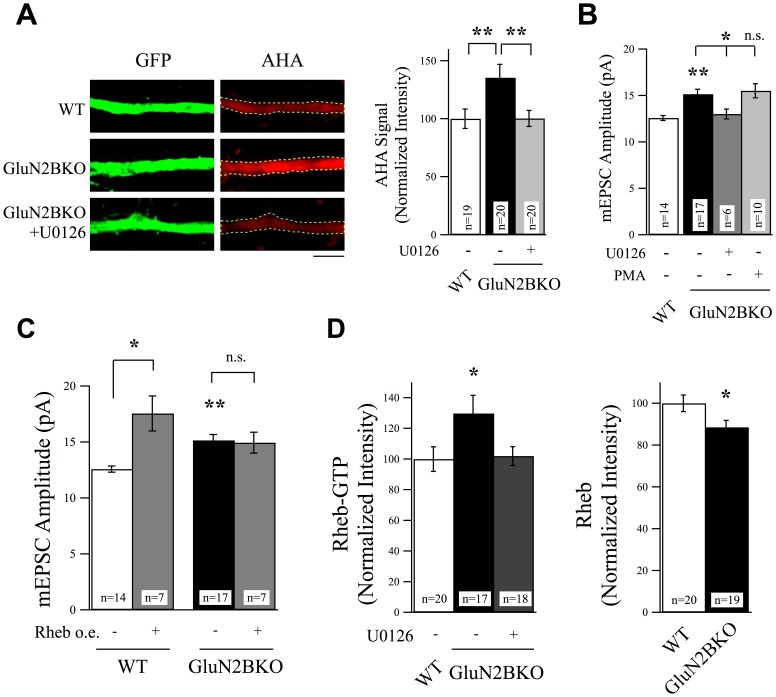
ERK and Rheb are Downstream of GluN2B Signaling.
(A) GluN2B knockout neurons revealed a significant increase in protein synthesis rates as evidenced by measuring AHA incorporation rates. This increase was suppressed by treatment with U0126 (25 µM, 6 hr), scale bar = 5 µm. (B) U0126 also suppressed the increase in mEPSC amplitudes observed in non-treated in GluN2B knockout neurons. Activation of ERK activity using PMA did not cause any further increase in mEPSC amplitudes in GluN2B knockout neurons. (C) The Rheb overexpression-induced increase in mEPSC amplitudes observed in WT neurons was occluded in GluN2B knockout neurons. (D) Rheb-GTP levels, determined using anti-Rheb-GTP antibody, increased in GluN2B knockout neurons. The total levels of Rheb signal were reduced in the absence of GluN2B.
Rheb‐GTP assay
Rheb‐GTP levels were measured using the Rheb Activation Assay Kit (NewEast Biosciences) according to the manufacturer’s instructions. A configuration‐specific Rheb‐GTP monoclonal antibody that immunoprecipitated Rheb‐GTP was used.
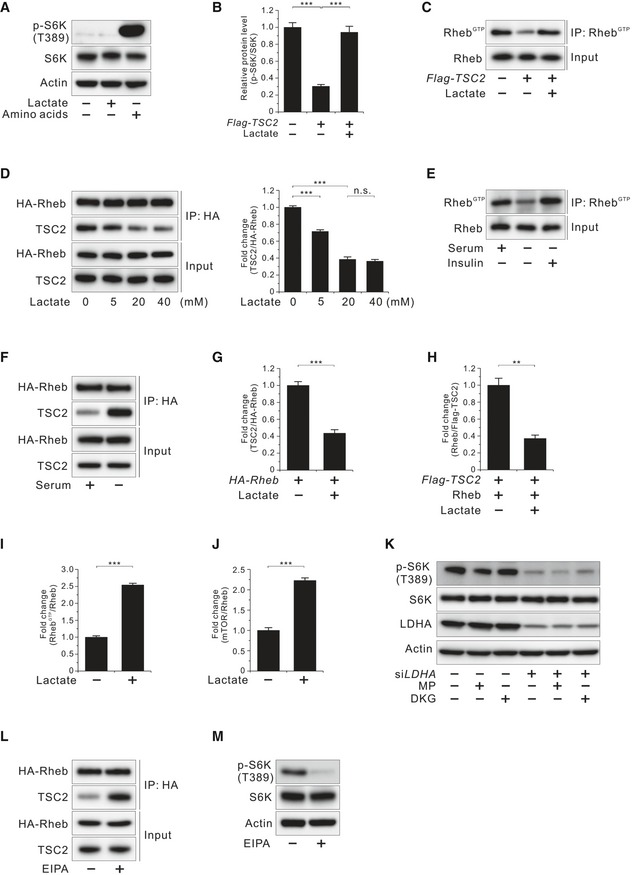
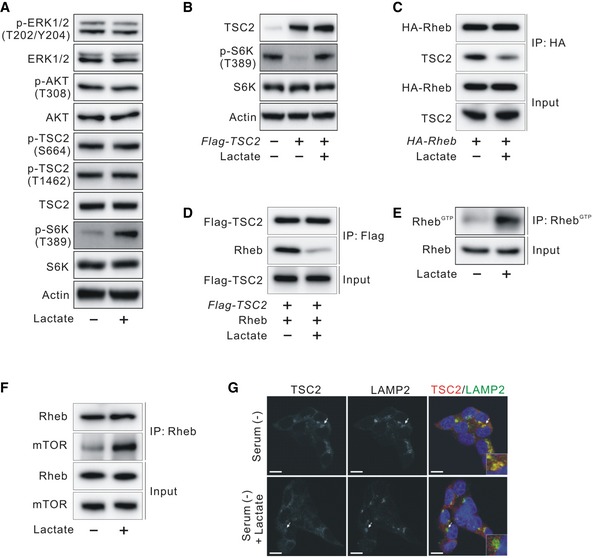
Effects of lactate on TSC2 and Rheb interaction and Rheb‐GTP levels
- Effect of lactate on phosphorylated S6K (T389) inhibited by amino acid deprivation in HCT116 cells.
- Effect of lactate on phosphorylated S6K (T389) inhibited by TSC2 overexpression in HCT116 cells as shown in Fig 3B. Quantitative densitometric data are the mean ± SEM of three independent measurements. ***P < 0.001; unpaired t‐test.
- Effect of lactate on Rheb activation inhibited by TSC2 overexpression in HCT116 cells.
- Molecular interaction between TSC2 and Rheb at the indicated doses of lactate in HA‐Rheb‐overexpressing HCT116 cells after serum deprivation overnight. Data in the bar graphs are the mean ± SEM of three independent measurements. n.s., not significant; ***P < 0.001; unpaired t‐test.
- Rheb‐GTP level in HCT116 cells. HCT1116 cells were serum‐starved overnight and then stimulated with insulin (100 nM, 10 min).
- Molecular interaction between TSC2 and Rheb in the presence or absence of serum in HA‐Rheb‐overexpressing HCT116 cells.
- Molecular interaction between TSC2 and Rheb in the presence or absence of lactate in HA‐Rheb‐overexpressing HCT116 cells after serum deprivation overnight as shown in Fig 3C. Quantitative densitometric data are the mean ± SEM of three independent measurements. ***P < 0.001; unpaired t‐test.
- Molecular interaction between TSC2 and recombinant GDP‐loaded Rheb in the presence or absence of lactate in vitro as shown in Fig 3D. Quantitative densitometric data are the mean ± SEM of three independent measurements. **P < 0.01; unpaired t‐test.
- Effect of lactate on Rheb activation in serum‐starved HCT116 cells as shown in Fig 3E. Quantitative densitometric data are the mean ± SEM of three independent measurements. ***P < 0.001; unpaired t‐test.
- Interaction between endogenous Rheb and mTOR in the presence or absence of lactate in HCT116 cells after serum deprivation overnight as shown in Fig 3F. Quantitative densitometric data are the mean ± SEM of three independent measurements. ***P < 0.001; unpaired t‐test.
- Effect of methyl pyruvate (MP; 10 mM, 45 min) or dimethyl α‐ketoglutarate (DKG; 5 mM, 45 min) on phosphorylated S6K (T389) in LDHA‐knockdown HCT116 cells.
- Molecular interaction between TSC2 and Rheb with or without EIPA (50 μM, 2 h) in HA‐Rheb‐overexpressing HCT116 cells after serum deprivation overnight.
- Effect of EIPA (50 μM, 2 h) on phosphorylated S6K (T389) in HCT116 cells shown in (L).
Rheb‐GTP assay
Rheb‐GTP levels were measured using the Rheb Activation Assay Kit (NewEast Biosciences) according to the manufacturer’s instructions. A configuration‐specific Rheb‐GTP monoclonal antibody that immunoprecipitated Rheb‐GTP was used.
Effects of lactate on TSC2 and Rheb interaction and TSC2 lysosomal localization
- Effect of lactate on the ERK/TSC2 and AKT/TSC2 signaling pathway in serum‐starved HCT116 cells.
- Effect of lactate on phosphorylated S6K (T389) inhibited by TSC2 overexpression in HCT116 cells.
- Molecular interaction between TSC2 and Rheb in the presence or absence of lactate in HA‐Rheb‐overexpressing HCT116 cells after serum deprivation overnight.
- Molecular interaction between TSC2 and recombinant GDP‐loaded Rheb in the presence or absence of lactate in vitro.
- Effect of lactate on Rheb activation in serum‐starved HCT116 cells.
- Interaction between endogenous Rheb and mTOR in the presence or absence of lactate in HCT116 cells after serum deprivation overnight.
- Immunofluorescence analysis of staining for TSC2 and LAMP2 in the presence or absence of lactate in HCT116 cells after serum deprivation overnight. Arrows indicate the enlarged view in the bottom of each right panel. Scale bar, 10 μm.
Rheb‐GTP assay
Rheb‐GTP levels were measured using the Rheb Activation Assay Kit (NewEast Biosciences) according to the manufacturer’s instructions. A configuration‐specific Rheb‐GTP monoclonal antibody that immunoprecipitated Rheb‐GTP was used.
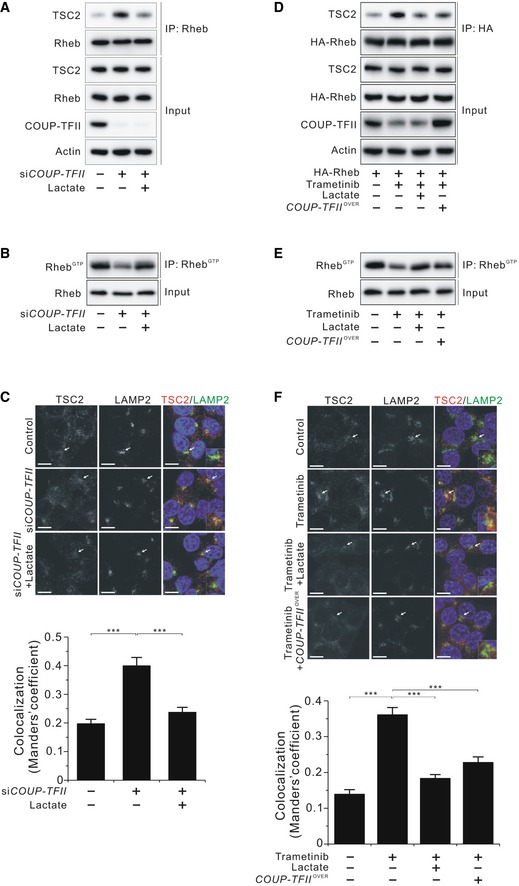
Effects of COUP‐TFII on TSC2 and Rheb interaction, TSC2 lysosomal localization, and Rheb‐GTP levels
- Interaction between endogenous TSC2 and Rheb in the presence or absence of lactate in COUP‐TFII‐silenced HCT116 cells.
- Effect of lactate on Rheb activation in COUP‐TFII‐silenced HCT 116 cells.
- Immunofluorescence analysis of staining for TSC2 and LAMP2 in HCT116 cells shown in (B). Arrows indicate the enlarged view in the bottom of each right panel. Scale bar, 10 μm. The degree of colocalization of TSC2 and LAMP2 is graphed as the mean ± SEM from three independent fields with at least 20 cells. ***P < 0.001; Mann–Whitney test.
- Molecular interaction between TSC2 and Rheb in the presence or absence of lactate in HA‐Rheb‐ and/or COUP‐TFII‐overexpressing HCT116 cells treated with 25 nM trametinib for 24 h.
- Effects of lactate and COUP‐TFII overexpression on Rheb activation in HCT116 cells treated with 25 nM trametinib for 24 h.
- Immunofluorescence analysis of staining for TSC2 and LAMP2 in HCT116 cells shown in (E). Arrows indicate the enlarged view in the bottom of each right panel. Scale bar, 10 μm. The degree of colocalization of TSC2 and LAMP2 is graphed as the mean ± SEM from three independent fields with at least 20 cells. ***P < 0.001; unpaired t‐test.
The activated/active state of Rheb, i.e., the percent of Rheb molecules in the active GTP bound state, was determined for the endogenous protein using the Rheb Activation Assay Kit utilizing a configuration-specific monoclonal antibody that recognizes and immunoprecipitates Rheb-GTP but not Rheb-GDP. The measurement of GTP/GDP charged state of Rheb was assayed as described earlier (Nobukuni et al., 2005, Roccio et al., 2006, Smith et al., 2005, Wolthuis et al., 1997). Detection was performed using a PhosphorImager and quantification using ImageJ. Assays were performed as detailed in the Supplemental Experimental Procedures.
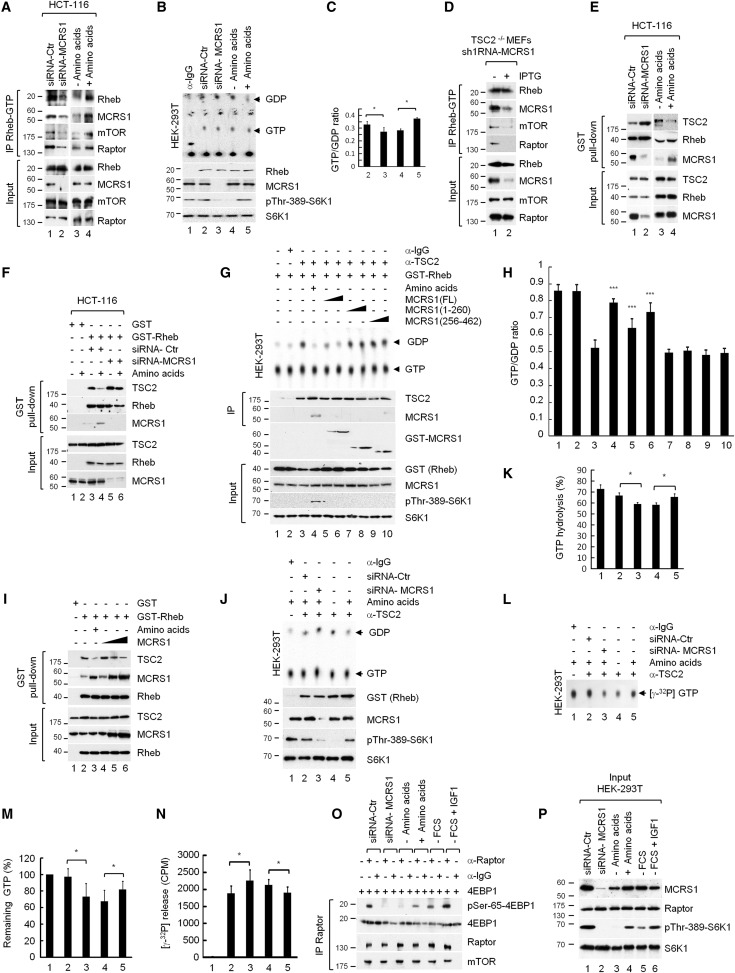
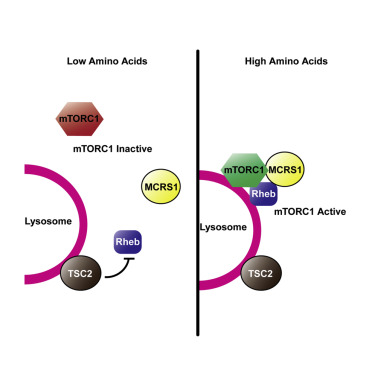
Figure 5 MCRS1 Regulates Rheb Activity
- (A) HCT-116 cells transfected with siRNA-Ctr (control) or siRNA-MCRS1 were serum-starved for 16 hr followed by AA deprivation for 1 hr or AA deprivation for 1 hr and then re-stimulated with AAs for 10 min. Cell lysates were processed for Rheb-GTP immunoprecipitation using a configuration-specific Rheb-GTP monoclonal antibody.
Measurement of cellular Rheb-GTP levels
To measure Rheb-GTP levels, we used a Rheb activation assay kit (81201; New East Biosciences, Malvern, PA) according to the manufacturer’s instructions.
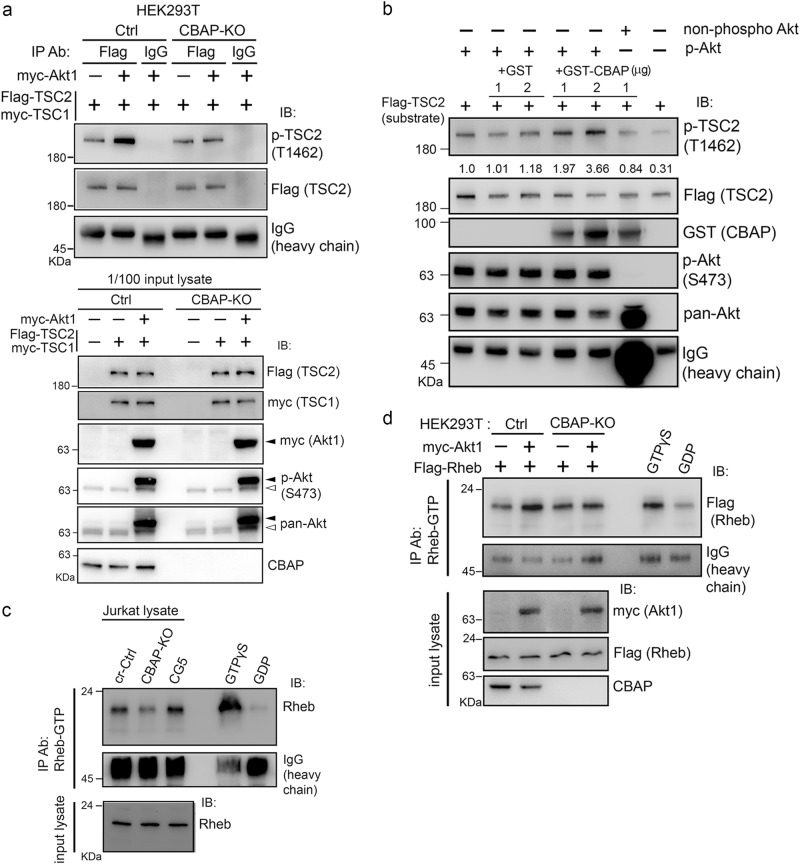
CBAP is crucial for Akt-mediated TSC2 phosphorylation and cellular Rheb-GTP levels.
a CBAP is required for Akt-mediated TSC2 phosphorylation. Various plasmids were transfected into HEK293T cells (Ctrl or CBAP-KO). Flag-TSC2 was immunoprecipitated with anti-Flag antibody and then the immunoprecipites were subjected to immunoblotting. The input levels of proteins are shown. Black and white arrows indicate exogenous and endogenous Akt proteins, respectively. N = 2. b In vitro Akt kinase activity on TSC2 is increased in the presence of recombinant GST-CBAP protein. An in vitro Akt kinase assay was established using in vitro-translated Flag-TSC2 protein as the substrate. Phospho-Akt (S473) and non-phospho-Akt were immunopurified from CBAP-KO Jurkat cells treated with or without MK2206. Quantification of the levels of phosphorylated TSC2 normalized to total TSC2 protein is indicated above the lanes. One representative picture from two independent experiments was shown. c Absence of CBAP is correlated with low levels of Rheb-GTP in Jurkat cells. Endogenous Rheb-GTP levels were evaluated by immunoprecipitation using an antibody that selectively recognizes Rheb-GTP. Lysates were treated with GTPγS or GDP, which were included as positive and negative controls, respectively. d CBAP is essential for the Akt-induced increase in Rheb-GTP levels. Ctrl and CBAP-KO HEK293T cells were transfected with the indicated plasmids before Rheb-GTP levels were determined in the lysates as described in (c). Expression levels of the transfected plasmids were determined by immunoblotting using tag-specific antibodies. N = 2
Rheb GTPγS Guanine Nucleotide Binding Assay
A375 cells were transfected with iNOS-targeting or control siRNA as described above. Forty hours after transfection, cells were washed once with phosphate-free Dulbecco’s modified Eagle’s Medium (Invitrogen), and processed with the Rheb Activation Assay Kit (NewEast Biosciences, Malvern, PA) as previously described (23). For positive and negative controls, A375 cell lysate, was incubated with guanosine 5′-O-[γ-thio] triphosphate (GTP-γS) or GDP respectively for 90 min before immunoprecipitation.
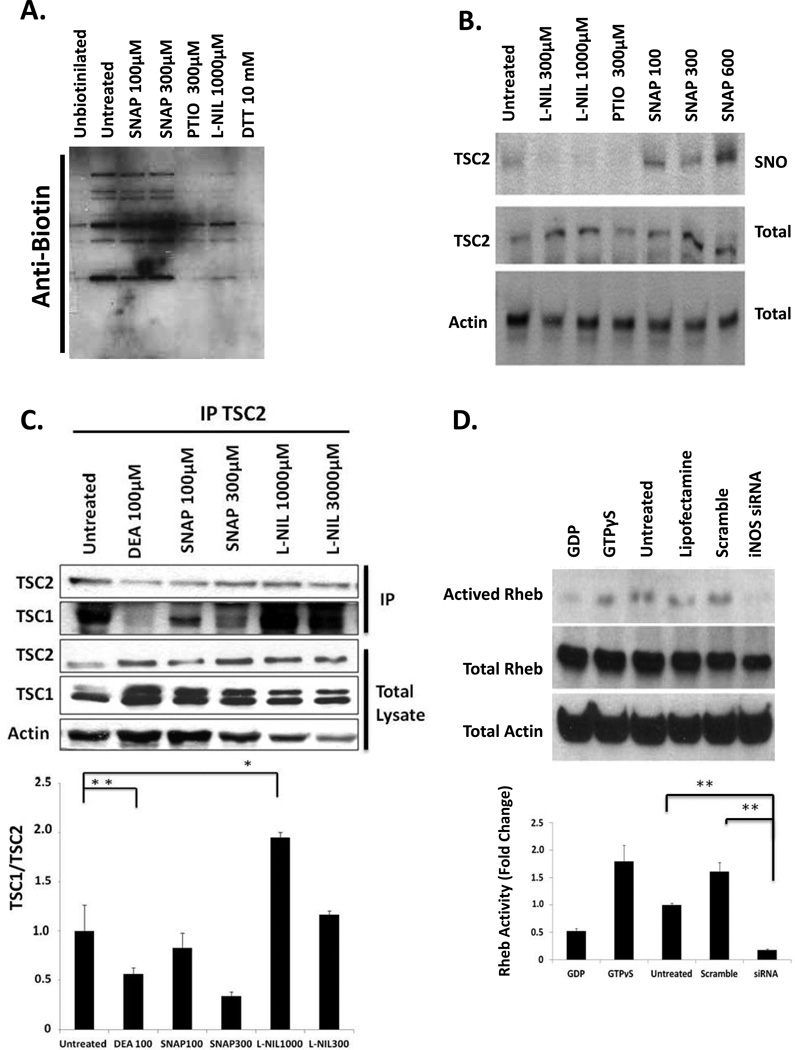
Reversible S-nitrosylation of TSC2 blocks TSC1-TSC2 dimerization and upregulates Rheb activity
A375 cells were cultured with the indicated concentrations of L-NIL, the NO donor S-nitroso-acetyl-penicillamine (SNAP), or the NO scavenger 2-phenyl-4,4,5,5-tetramethylimidazoline-1-oxyl-3 oxide (PTIO) for 16 Hours prior to harvest and preparation of protein lysates. As a negative control, parallel lysates were exposed to 10 mM of SH-reducing agent dithiothreitol (DTT) for 1 hour in vitro. (A) Total S-nitrosylated protein levels were determined by biotin switch assay and anti-biotin immunoblot; “unbiotinylated” shows endogenous biotin levels. (B) S-Nitrosylation of TSC2 in biotin switch assay followed by immunoprecipitation with streptavidine agarose and immunoblot analysis with anti-TSC2 polyclonal antibody. “SNO” (S-nitrosothiol) indicates biotinylated (nitrosylated) TSC2 levels following biotin switch. “Total” indicates total TSC2 levels prior to immunoprecipitation. Actin was used as a loading control. (C) Effect of iNOS/NO on TSC2/TSC1 dimerization. A375 cells were treated with NO donors DEANONOate or SNAP, or the selective iNOS inhibitor L-NIL, and cell lysates were immunoprecipitated (IP) with anti-TSC2 antibody. Immunocomplexes (upper panel) and crude lysates (lower panel) were immunoblotted with anti-TSC1, -TSC2, or –actin antibody. The ratio of TSC1 to TSC2 was calculated and normalized against the amount of TSC2 present after the immnunoprecipitation (D) Effect of iNOS/NO on Rheb activation. A375 cells were transfected with iNOS-targeting siRNA or scrambled control and cultured for 48 hours. Western blots for activated Rheb (Rheb/GTP) total Rheb, including the inactive GDP-Bound form (GDP), and actin loading control were performed. Actived Rheb was quantified by densitometry and normalized to total Rheb levels. All graphs represent data from 3 independent experiments.
Rheb GTPγS Guanine Nucleotide Binding Assay
A375 cells were transfected with iNOS-targeting or control siRNA as described above. Forty hours after transfection, cells were washed once with phosphate-free Dulbecco’s modified Eagle’s Medium (Invitrogen), and processed with the Rheb Activation Assay Kit (NewEast Biosciences, Malvern, PA) as previously described (23). For positive and negative controls, A375 cell lysate, was incubated with guanosine 5′-O-[γ-thio] triphosphate (GTP-γS) or GDP respectively for 90 min before immunoprecipitation.
Reversible S-nitrosylation of TSC2 blocks TSC1-TSC2 dimerization and upregulates Rheb activity
A375 cells were cultured with the indicated concentrations of L-NIL, the NO donor S-nitroso-acetyl-penicillamine (SNAP), or the NO scavenger 2-phenyl-4,4,5,5-tetramethylimidazoline-1-oxyl-3 oxide (PTIO) for 16 Hours prior to harvest and preparation of protein lysates. As a negative control, parallel lysates were exposed to 10 mM of SH-reducing agent dithiothreitol (DTT) for 1 hour in vitro. (A) Total S-nitrosylated protein levels were determined by biotin switch assay and anti-biotin immunoblot; “unbiotinylated” shows endogenous biotin levels. (B) S-Nitrosylation of TSC2 in biotin switch assay followed by immunoprecipitation with streptavidine agarose and immunoblot analysis with anti-TSC2 polyclonal antibody. “SNO” (S-nitrosothiol) indicates biotinylated (nitrosylated) TSC2 levels following biotin switch. “Total” indicates total TSC2 levels prior to immunoprecipitation. Actin was used as a loading control. (C) Effect of iNOS/NO on TSC2/TSC1 dimerization. A375 cells were treated with NO donors DEANONOate or SNAP, or the selective iNOS inhibitor L-NIL, and cell lysates were immunoprecipitated (IP) with anti-TSC2 antibody. Immunocomplexes (upper panel) and crude lysates (lower panel) were immunoblotted with anti-TSC1, -TSC2, or –actin antibody. The ratio of TSC1 to TSC2 was calculated and normalized against the amount of TSC2 present after the immnunoprecipitation (D) Effect of iNOS/NO on Rheb activation. A375 cells were transfected with iNOS-targeting siRNA or scrambled control and cultured for 48 hours. Western blots for activated Rheb (Rheb/GTP) total Rheb, including the inactive GDP-Bound form (GDP), and actin loading control were performed. Actived Rheb was quantified by densitometry and normalized to total Rheb levels. All graphs represent data from 3 independent experiments.
Rheb-GTP assay
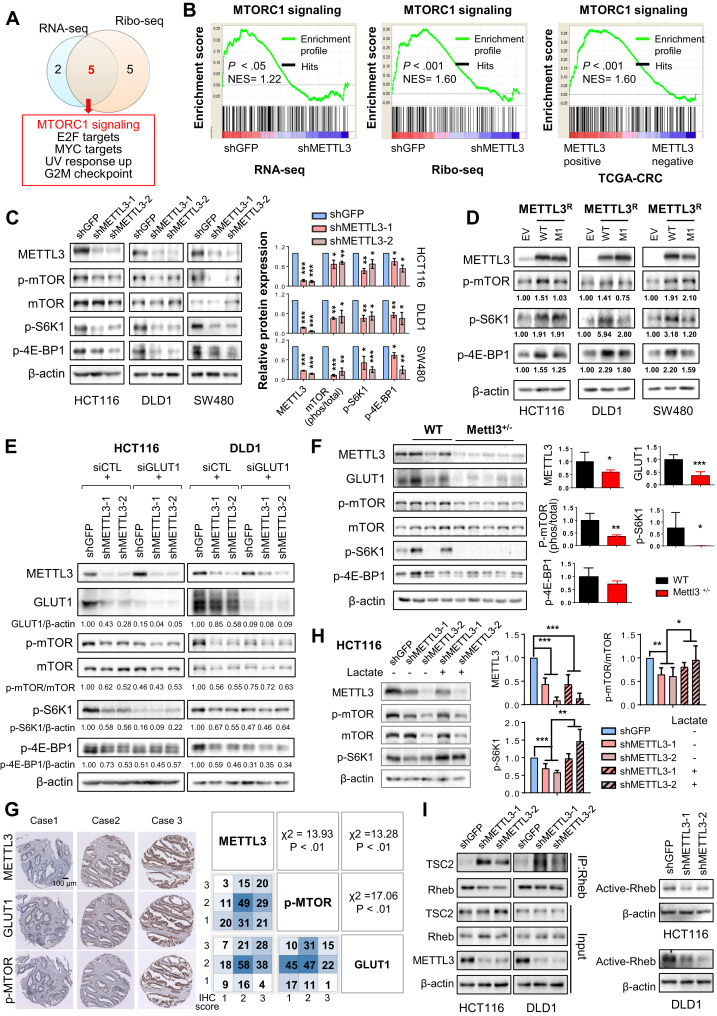
METTL3 promotes m6A-GLUT1-mTORC1 axis.
(A) Venn diagram showing overlaps between gene sets analyzed by RNA-seq and Ribo-seq. (B) Enrichment plots of mTORC1 signaling. Right panel shows analysis of TCGA-CRC cohort. (C) Depletion of METTL3 inactivated mTORC1 signaling by western blot. (D) Ectopic expression of METTL3-wt, but not METTL3-mut1, promoted mTORC1 signaling. (E) HCT116 and DLD1 cells were expressed with indicated shRNA and siRNA, and Western blot was performed. (F) Western blot analysis of colon tissues from littermate WT and Mettl3+/– mice treated with AOM-DSS. (G) Representative images of METTL3, GLUT1, and p-MTOR protein expression in CRC tissue arrays (n = 197) by IHC. Right panel shows Pearson correlation analysis between METTL3, GLUT1, and p-MTOR protein expression. (H) HCT116 cells were infected with METTL3-shRNAs and treated with 20 mmol/L sodium lactate for 1 hour. (I) Immune complexes were precipitated by anti-Rheb and immunoblotted by anti-TSC2 or anti-Rheb. Rheb-GTP was determined using the Rheb Activation Assay kit (NewEastBio). The relative expression levels of individual proteins in C, D, E, F, and H were normalized against β-actin, except p-MTOR, which was normalized against total mTOR. For D, E, and I, data are representative of 2 independent experiments. Error bars in C and H represent mean ± standard deviation from at least 3 independent experiments. ∗P < .05, ∗∗P < .01, ∗∗∗P < .001; 2-tailed t test (C, F, and H) or Pearson chi-square test (G).
Membrane association measurements, farnesylation and Rheb activation assay
Spermatogenic cell pellets were lysed, homogenized, and ultracentrifuged to fractionate membrane proteins and cytoplasmic proteins53. These subcellular fractions were quantified and adjusted to 400 ng and immunoprecipitated using the Rheb antibody, which were subsequently subjected to western blot analysis to determine the proteins that were present in each fraction. Rheb activation was assessed using a Rheb Activation Assay Kit (New East Biosciences).
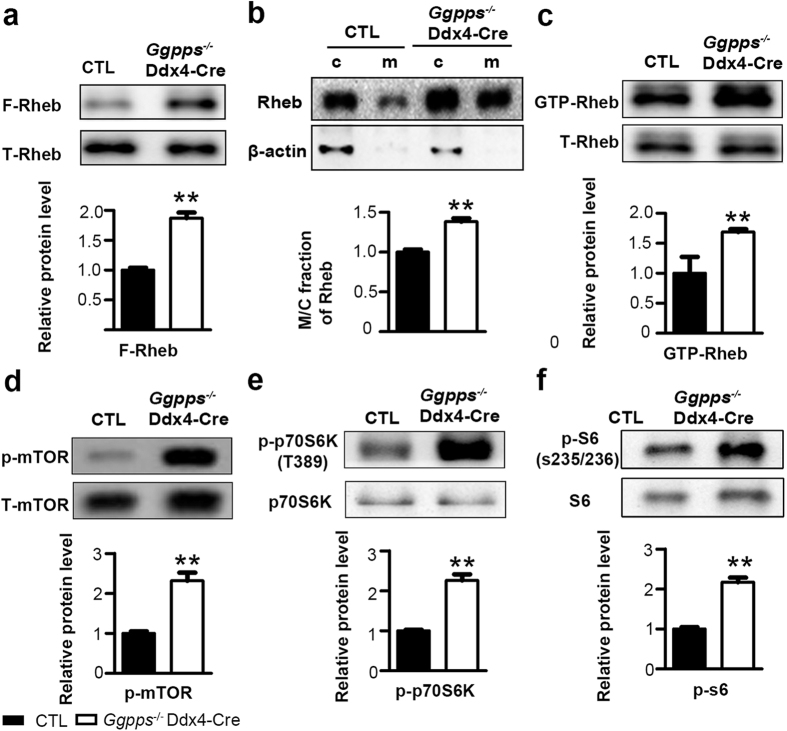
Germ cell deletion of Ggpps enhances Rheb farnesylation and induces spermatogonia differentiation via the mTORC1 pathway.
(a) Rheb farnesylation increased in Ggpps−/− Ddx4-Cre spermatogenic cells. **p = 1.01E-03 (b) Rheb membrane association increased in Ggpps−/−Ddx4-Cre spermatogenic cells. **p = 1.88E-03 (c) Activated GTP-bound Rheb increased in Ggpps−/− Ddx4-Cre spermatogenic cells. **p = 6.73E-03 (d–f) Western blot analysis was performed for p-mTOR (Ser2448), mTOR, p-p70S6K (Thr389), p70S6K, p-S6 (Ser235/236) and S6, showing hyper activation of the mTORC1 pathway. P-mTOR **p = 3.19E-03, p-p70S6K **p = 6.34E-05, p-p70 **p = 8.06E-04.The gels were run under the same experimental conditions. The full-length blots are presented in Supplementary Figs 3–8. Relative protein levels determined by density analysis and normalized by corresponding total protein control.
RHEB activation assay
The RHEB activation assay (NewEast Biosciences) was performed according to the manufacturer’s protocol. Before RHEB-GTP immunoprecipitation the samples were adjusted to an equal protein concentration to ensure comparability and a portion of each sample was subjected to immunoblot analysis using actin as a loading control.
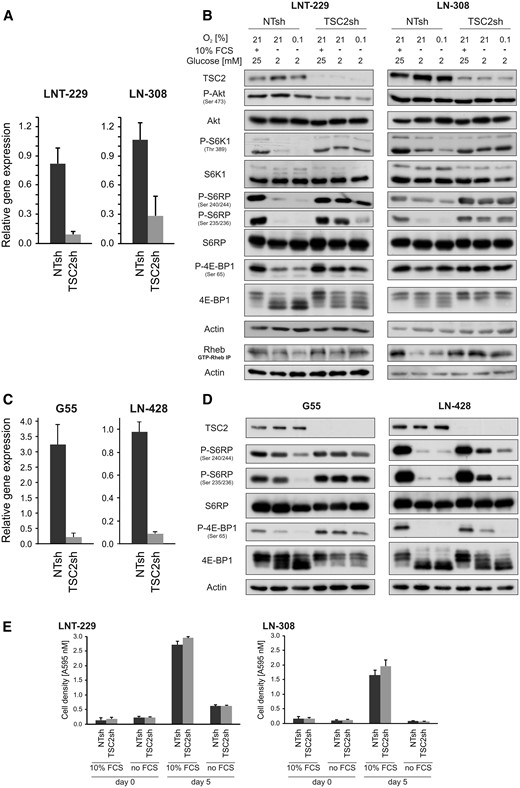
TSC2 gene suppression activates mTORC1 signalling during nutrient deprivation and hypoxia.
(A) LNT-229 and LN-308 TSC2sh and control cells (non-targeting sequence, NTsh) were analysed by qPCR. TSC2 gene suppression was confirmed. Values are normalized to 18S as well as SDHA housekeeping gene expression (n = 3, mean ± SD). (B) LNT-229 and LN-308 cells were incubated for 4 h, as indicated. Cellular lysates were analysed by immunoblot with antibodies for TSC2, P-Akt (Ser 473), Akt, P-S6K1 (Thr 389), S6K1, P-S6RP (Ser 240/244 and Ser 235/235), S6RP, P-4E-BP1 (Ser 65), 4E-BP1 or actin. The same incubation conditions were used for immunoprecipitation of GTP-RHEB. The precipitate was then analysed by immunoblot with an antibody for RHEB as well as an immunoblot with an antibody for actin as a loading control of the employed lysate (lower two lanes). (C) G55 (left) and LN-428 (right) NTsh and TSC2sh cells were analysed by qPCR. TSC2 gene suppression was confirmed, values are normalized to 18S as well as SDHA housekeeping gene expression (n = 3, mean ± SD). (D) G55 (left) and LN-428 (right) cells were incubated for 4 h, as indicated. Cellular lysates were analysed by immunoblot with antibodies for TSC2, P-S6RP (Ser 240/244 and Ser 235/235), S6RP, P-4E-BP1 (Ser 65), 4E-BP1 or actin. (E) LNT-229 and LN-308 cells were incubated in serum-free and serum containing (10% FCS) culture conditions without glucose restriction (25 mM glucose) for 5 days. Cell density was measured by crystal violet staining at the beginning of cultivation and after 5 days (n = 4, mean ± SD).
RHEB activation assay
The RHEB activation assay (NewEast Biosciences) was performed according to the manufacturer’s protocol. Before RHEB-GTP immunoprecipitation the samples were adjusted to an equal protein concentration to ensure comparability and a portion of each sample was subjected to immunoblot analysis using actin as a loading control.
TSC2 gene suppression activates mTORC1 signalling during nutrient deprivation and hypoxia.
(A) LNT-229 and LN-308 TSC2sh and control cells (non-targeting sequence, NTsh) were analysed by qPCR. TSC2 gene suppression was confirmed. Values are normalized to 18S as well as SDHA housekeeping gene expression (n = 3, mean ± SD). (B) LNT-229 and LN-308 cells were incubated for 4 h, as indicated. Cellular lysates were analysed by immunoblot with antibodies for TSC2, P-Akt (Ser 473), Akt, P-S6K1 (Thr 389), S6K1, P-S6RP (Ser 240/244 and Ser 235/235), S6RP, P-4E-BP1 (Ser 65), 4E-BP1 or actin. The same incubation conditions were used for immunoprecipitation of GTP-RHEB. The precipitate was then analysed by immunoblot with an antibody for RHEB as well as an immunoblot with an antibody for actin as a loading control of the employed lysate (lower two lanes). (C) G55 (left) and LN-428 (right) NTsh and TSC2sh cells were analysed by qPCR. TSC2 gene suppression was confirmed, values are normalized to 18S as well as SDHA housekeeping gene expression (n = 3, mean ± SD). (D) G55 (left) and LN-428 (right) cells were incubated for 4 h, as indicated. Cellular lysates were analysed by immunoblot with antibodies for TSC2, P-S6RP (Ser 240/244 and Ser 235/235), S6RP, P-4E-BP1 (Ser 65), 4E-BP1 or actin. (E) LNT-229 and LN-308 cells were incubated in serum-free and serum containing (10% FCS) culture conditions without glucose restriction (25 mM glucose) for 5 days. Cell density was measured by crystal violet staining at the beginning of cultivation and after 5 days (n = 4, mean ± SD).
Active Rheb immunoprecipitated assay
Active Rheb was Immunoprecipitated by Rheb activation assay kit from NewEast Biosciences, all subsequent steps of the active Rheb Immunoprecipitated were performed according to manufacturer’s description. In brief, transfected HEK293T were harvested on ~90% confluency, cells were lysed in lysis buffer at 4 °C for 30 min., the soluble fraction of the cell lysates was isolated via centrifugation at 12,000 rpm in a microcentrifuge for 15 min at 4 °C. For IP the active Rheb, the cell lysate was centrifuged to remove the cell debris and incubated with protein A/G beads and anti-active Rheb monoclonal antibody for 2 h. Then the beads were washed 3 times with lysis buffer, and suspended in 40 μl SDS-PAGE sample buffer. The proteins were boiled, resolved via SDS-PAGE gel electrophoreses, and analyzed via immunoblotting. The proteins were detected using the Odyssey system (LI-COR Biosciences).
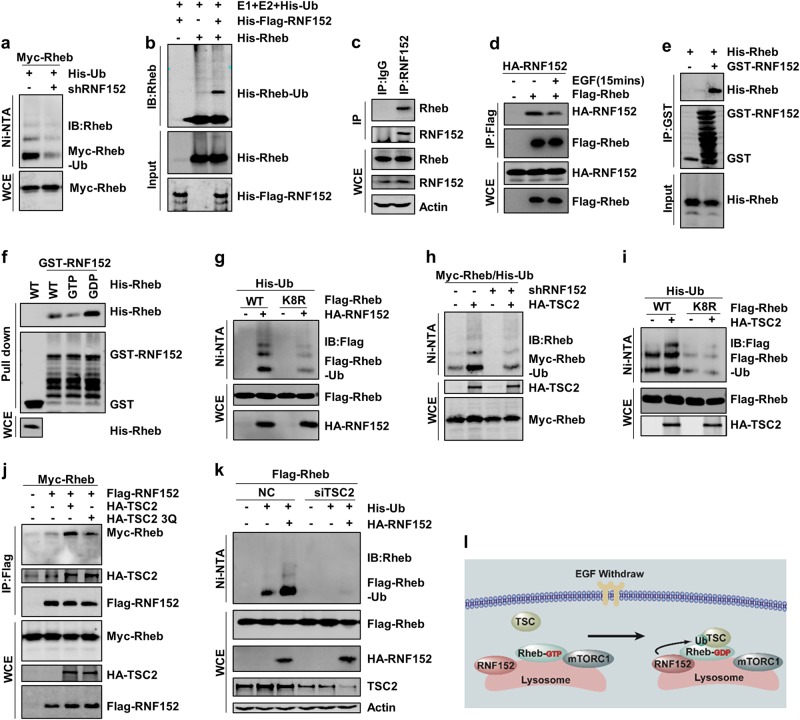
RNF152 is involved in TSC2-mediated Rheb ubiquitination.
a Rheb ubiquitination was detected in RNF152 knockdown cells. The knockdown efficiency of RNF152 was detected via RT-PCR in Supplementary information, Fig. S2d. b RNF152 enhanced Rheb ubiquitination in vitro. c, d Endogenous(c) and exogenous (d) interaction between Rheb and RNF152 was examined in HEK293T cells with EGF stimulation. e RNF152 could specifically interact with His-tagged Rheb detected by GST pull-down assay. f Pull-down assay was performed to detect the interaction between GST-RNF152 and His-Rheb, and Rheb was loaded with GDP or GTP in advance. g Rheb-K8R displayed lower ubiquitination level than Rheb-WT when co-expressed with RNF152. h TSC2-induced Rheb ubiquitination decreased in RNF152 knockdown HEK293T cells. The knockdown efficiency was detected by RT-PCR in Supplementary information, Fig. S2d. i Ubiquitination of Rheb-WT or Rheb-K8R mutant was detected with or without TSC2 in HEK-293T cells. j Co-IP assay was performed to test the interaction between Rheb and RNF152 after co-expressed with TSC2 or TSC2-3Q mutant. k Ubiquitination of Rheb was detected in TSC2-depleted HEK293T cell line. l The model of Rheb ubiquitination: TSC complex inactivates Rheb in the absence of EGF, which consequently promotes Rheb-GDP to interact with RNF152 followed by subsequent Rheb ubiquitination