


Published IHC and IF Pictures for 26909 Ras-GTP mAb

Immunoblotting
Proteins were extracted from cells or frozen tissue; the samples were run on SDS polyacrylamide gels of 8–15% depending on molecular weight of protein of interest and transferred on to nitrocellulose membrane. Following transfer the membranes were probed with primary antibodies for K-Ras (OP24, Calbiochem, EMD Millipore, MA, USA), GAPDH (Ma3374, Millipore), Jag 1 (sc-8303, Santa Cruz, CA, USA), pErK (4370, Cell Signaling, MA, USA), α-SMA (Ab5694, Abcam), Active Ras-GTP Monoclonal Antibody (26909, NewEast Bioscience) and subsequently probed with the appropriate secondary anti-mouse IgG or anti-rabbit IgG. Densitometry was performed using ImageJ software provided by NIH.
Histology
Tissue was fixed in buffered formalin for 24 hours, embedded in paraffin, cut into 4 µm-thick sections and stained with H&E or special stains.
Special stains
Sections stained using the picro-Mallory trichrome (PMT) and picrosirius red (PSR) techniques were used to assess fibrosis. All sections were viewed under bright light. The degree of cortical fibrosis was scored using NIS-elements-Br 3.10, measuring the blue and red areas respectively in a randomized and blinded manner. The slides were quantified using a 200x quantification and the number of fields quantified depended on the stain in question. 10, 15, 20, and 25 fields per section were measured for the first three sections assessed from each stain. The average for each was compared, and when an increase in field number no longer changed the average by more than 10%, it was deemed an adequate number of fields for each section for that stain. The minimum number of fields per section sections for a stain was 10 with a maximum of 20.
Immunohistochemistry
Sections were mounted on polylysine-coated slides, baked at 40 °C overnight and deparaffinised. Antigen retrieval was performed by pressure-cooking in a citrate buffer (pH6) as required. Antibodies used were directed against modified oligonucleotides (supplied by Ionis Pharmaceuticals, rabbit polyclonal), α-smooth muscle actin (α-SMA) (A2547; Sigma-Aldrich Co. Ltd.). They were subsequently detected with a secondary ImmPRESS polymer reagents and DAB substrate (brown) (Vector Labs, California, US).
K-Ras expression is upregulated in chronic folic acid nephropathy (CFAN) and K-Ras activation is increased in CFAN and unilateral ureteric obstruction. Male CD1 mice received 2 intravenous doses of 125 mg/kg of folic acid (FA) or normal saline (control). Male Wistar rats underwent laparotomy followed by unilateral ureteric obstruction. Sham operated rats underwent laparotomy alone. (a) Total kidney mRNA was extracted from mice with chronic folic acid nephropathy (CFAN) (grey columns) or age-matched untreated controls (white columns) from different time periods and subjected to reverse transcription followed by quantitative PCR for K-Ras expression normalised to GAPDH. Each point or band represents a single animal, 8–16 animals in each treatment group. (b) Total Kidney lysate from CD1 mice with and without CFAN was subjected to immunoprecipitation (IP) followed by western blotting for K-Ras. The total cell lysate from the (IP) was then immunoblotted for GAPDH as an IP control. The densitometry ratio of K-Ras to GAPDH contains data from 4 untreated and 5 CFAN mice (Supplementary Fig. S2). (c) Total Kidney lysate from rats 16 days post UUO was subjected to western blotting for phosphorylated ERK 41/42 and compared with total ERK. A more complete image of this blot is shown in Supplementary Fig. S1. (d) Kidney sections from mice with CFAN (or untreated controls) were stained for GTP-bound (activated) Ras (left hand column) or phospho-ERK (right hand column). The tissue expression of these targets is seen as brown stain in the panels.
Immunofluorescence and Proximity Ligation Assay
Cells were fixed with 4% formaldehyde at RT for 15 min then washed twice with PBS. Blocking was done either for 1 h at RT or overnight at 4 C in blocking buffer (5% goat serum, 5% horse serum, 0.3% TritonX-100). Primary antibodies were incubated overnight at 4 C in blocking buffer and secondary antibodies were incubated for 1 hr at RT. Slides were then mounted in Prolong Gold with DAPI (Invitrogen). Primary antibodies used were as follows: anti-Panras C-4 (sc-166691, Santa Cruz Biotechnology), anti-RASGTP (26909, Neweast Bioscienes) (1:250 dilution), ……, anti-Mouse Alexa Fluor 555 (ThermoFischer Scientific), anti-Rabbit Alexa Fluor 488 (Thermo Fischer Scientific), and anti-Mouse Alexa Fluor 488 (ThermoFischer Scientific). Antisense oligos were ordered from Integrated DNA technologies with a 5′ biotin modification. These were incubated under the same conditions for antibodies and detected with the appropriate streptavidin-linked fluorophore conjugate (Thermo Scientific). Unless otherwise noted, all primary antibodies were used at a dilution of 1:1000 and all secondary antibodies used at a dilution of 1:250.
For PLA, Duolink mouse minus, rabbit plus, and In Situ Orange Reagents (Sigma-Aldrich) were used according to the manufacturer’s protocol. When applicable, a cytoskeletal stain using pre-conjugated 488 phalloidin was used (Invitrogen) after polymerase reaction and prior to slide mounting. Images were analyzed using ImageJ.
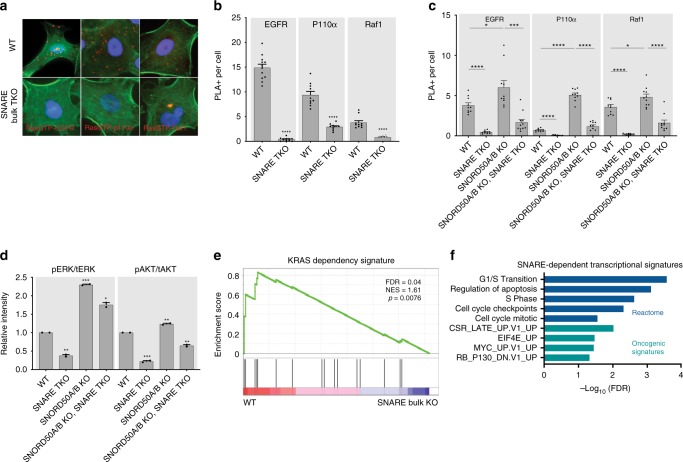
Downstream KRAS signaling relies on SNARE proteins. a Representative PLA images of Ras-GTP interaction with EGFR, P110α, and Raf1 in A549. F-actin labeled in green. b Quantification of PLA signal in a. c Proximity of KRAS with membrane bound receptors and signaling effector proteins measured by PLA in H23 cells. d ERK1/2 and AKT activation in H23 cells; quantitated replicate western blots of phosphorylated pERK and pAKT over total levels of these kinases (tERK, tAkt) are shown. e GSEA plot of KRAS-dependent transcripts against RNA-sequencing datasets of SNARE wild-type and KO cells in H23. f Gene sets lost upon SNARE TKO in H23, A549, and CHL1 from RNA sequencing. Error bars are s.e.m
Immunofluorescence and quantification of pixel intensity
Cells grown on glass coverslips were washed once with PBS and fixed using 4% PFA or ice-cold methanol. Cells were then permeabilized with 0.2% Triton X-100 in PBS. Primary antibodies were added to coverslips and incubated at 37°C for 1 h followed by multiple washes in PBS. Alexa Fluor secondary antibodies (Thermo Fisher Scientific) were added and incubated for 30 min, followed by PBS washes and mounting of coverslips in polyvinyl alcohol (Sigma-Aldrich). Samples were visualized using a DMR microscope (Leica Microsystems) fitted with 40-Å (NA 1.0, Plan Fluotar) and 63-Å (NA 1.32, Plan Apochromat) objective lenses, and images were captured with an Orca 100 charge-coupled device camera (model C4742-95; Hamamatsu Photonics) and MetaMorph 7.7 imaging software (Molecular Devices). Mean fluorescence pixel intensity was quantified using raw, unsaturated 12-bit images with line or area tracing as stated using ImageJ. For quantification of junctional/ID fluorescence intensity, cell borders as marked by Pg signal using ImageJ line tracing and fluorescence intensity of Pg and the costained protein were assessed from the same line position. Subsequently, signal intensity values of the protein of interest were normalized to Pg intensity.
Immunohistochemistry
Tissue samples were fixed in 10% neutral-buffered formalin and embedded in paraffin. Paraffin-embedded sections were deparaffinized in sequential xylene and ethanol washes. Antigen retrieval for paraffin-embedded sections was performed by heating samples to 95°C in 0.01 M citrate buffer. Sections were blocked in 10% normal goat serum and incubated with primary and secondary antibodies for 1 h at 37°C. After mounting in polyvinyl alcohol, sections were visualized as described above.
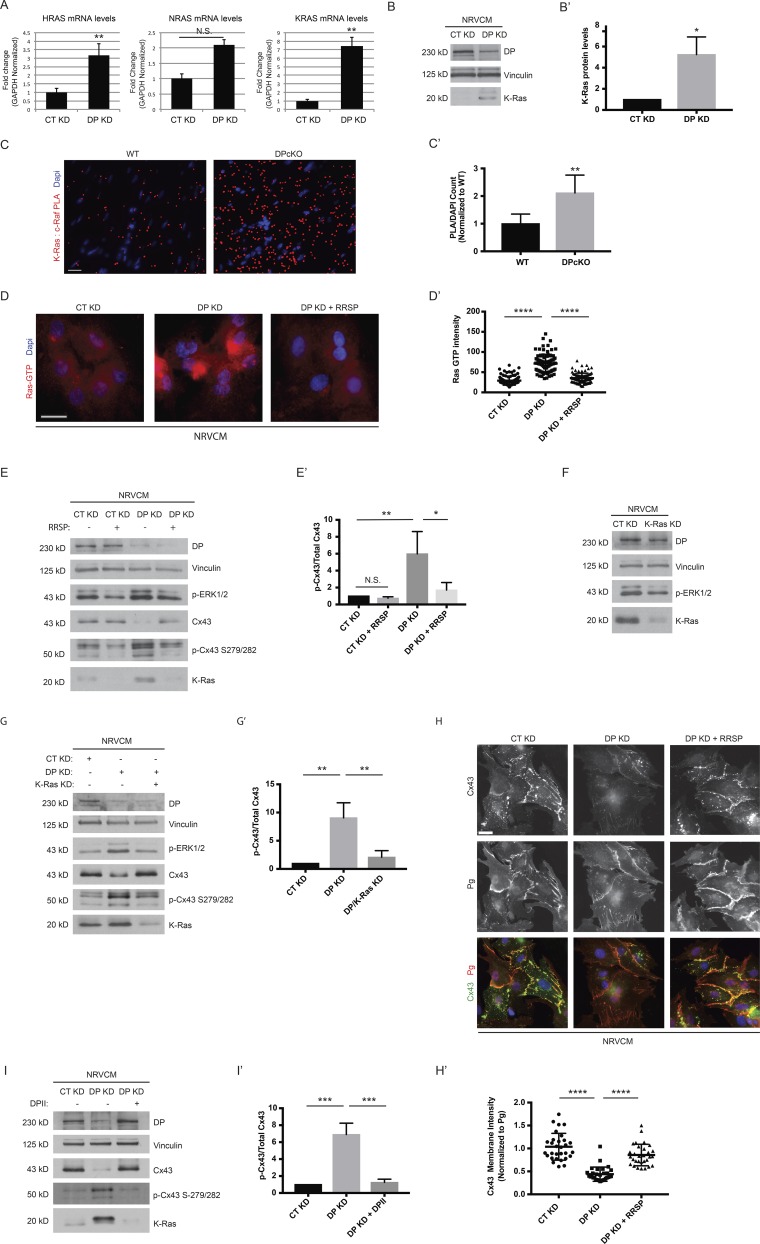
(A) Control and DP KD NRVCMs were analyzed for mRNA levels of KRAS, HRAS, and NRAS (n = 3). (B) NRVCMs treated with control and DP KD shRNA were blotted with a K-Ras antibody (n = 3). (B′) Densitometry quantification of K-ras levels normalized to loading controls. (C and C′) WT and DPcKO cardiac sections were subjected to PLA analysis with K-Ras/c-Raf antibody pairs (n = 3). Quantification of PLA signal normalized to DAPI count shows that K-Ras/c-Raf PLA signal is significantly increased in DPcKO compared with WT hearts. *, P < 0.05; **, P < 0.01 by two-tailed Student’s t test. (D) Immunofluorescence analysis of Ras-GTP staining was performed on control, DP KD, and DP KD NRVCMs treated with 2 nM RRSP (n = 3). (D′) Quantification of Ras GTP staining intensity. (E) CT KD and DP KD were compared with CT KD and DP KD NRVCMs treated with 2 nM RRSP by blotting for DP, p-ERK1/2, p-Cx43 S279/282, and Cx43 (n = 3). (E′) Densitometry quantification of p-Cx43 S279/282 to total Cx43 ratio. (F) Control and K-Ras KD NRVCMs were blotted for DP, p-ERK1/2, and K-Ras protein levels (n = 3). (G and G′) Control, DP KD, and DP/K-Ras double KD NRVCMs were subjected to Western blot analysis for DP, p-ERK1/2, Cx43, p-Cx43 S279/282, and K-Ras levels (n = 3). The ratio of Cx43 to p-Cx43 S279/282 was quantified by densitometry. (H) Control, DP KD, and DP KD NRVCMs treated with 2 nM RRSP were stained for Cx43 and Pg as a marker of cell junctions (n = 3). (H′) Quantification of Cx43 junctional intensity normalized to junctional Pg. Bars, 20 µm. (I and I′) Control, DP KD, and DP KD NRVCMs expressing DPII were blotted for DP, Cx43, p-Cx43 S279/282, and K-Ras. The ratio of Cx43 to p-Cx43 S279/282 was quantified by densitometry. Error bars represent mean ± SD. *, P < 0.05; **, P < 0.01; ***, P < 0.001; ****, P < 0.0001 by one-way ANOVA followed by Tukey’s post hoc test.
Immunofluorescence and Proximity Ligation Assay
Cells were fixed with 4% Paraformaldehyde at room temperature for 10 minutes. Blocking was done in 5% goat serum, 0.3% TritonX-100 in PBS for one hour. For Raf1, mTOR and mTOR complex PLA experiments, cells were placed in 0% FBS media overnight (~16hrs) and stimulated for 15 minutes with 10% FBS media prior to fixation. Formalin-fixed, paraffin embedded colorectal adenocarcinoma patient tissue samples were rehydrated in xylene and decreasing dilutions of ethanol followed by Citrate Buffer (pH 6.0) antigen retrieval (Abeam). Specimens were blocked in 5% goat serum, 0.3% Triton X-100 in PBS for one hour. For both cell and tissue PLA, anti-mouse PLUS and anti-rabbit MINUS Duolink secondaries with Duolink In Situ Orange Reagents were used according to the manufacturers protocol (Millipore Sigma). For Ki67 staining, cells were seeded onto glass slides and on day 3 of puromycin selection were starved for 22 hours. Cells fixed with 4% PFA for 15 minutes and were blocked in 5% goat serum, 5% horse serum, 0.3% Triton X-100 in PBS for 1 hour. Primary antibodies were as follows: ……. Anti-Active Ras (1:1000; 26909, NewEast Biosciences) has been reported as thoroughly validated to specifically recognizes Ras-GTP and not Ras-GDP in immunofluorescence experiments. Ki67 positive cells and PLA particle count and percent area signal were quantified using Fiji ImageJ (Schindelin et al., 2012) and normalized to the number of nuclei per field or percent DAPI area per field as indicated in the figure. For immunofluorescence (IF), PLA experiment matched slides were treated as above and incubated with anti-Mouse Alexa Fluor 555 and anti-Rabbit Alexa Fluor 488 (1:5000; Thermo Fisher Scientific) for 1 hr at room temperature.
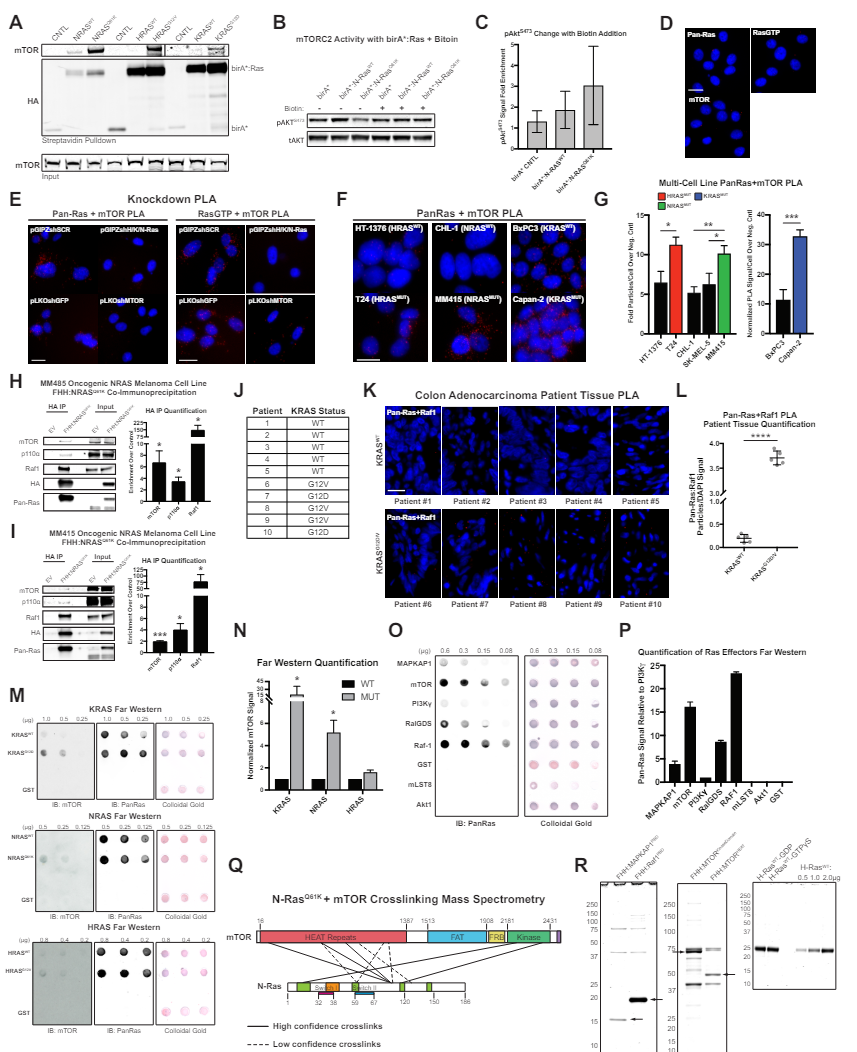
(E) Representative images of Pan-Ras or RasGTP and mTOR proximity ligation assay (PLA) with
indicated knockdown conditions. Scale bar, 20 µm.
(M) Representative Far Westerns with recombinant H, K, or NRASWT, GTPγs-loaded H, K, or NRASMT or
GST-negative control protein on membrane, probed with recombinant protein and antibody to mTOR.
Western blot for Pan-Ras and colloidal gold staining provide loading controls.
Immunofluorescence
Cortical neurons (2 DIV) were fixed for 30 min with 3.7% formaldehyde in PBS containing 20% sucrose at 37 °C, quenched for 5 min in 0.1 m glycine at room temperature, permeabilized for 5 min in 0.25% Triton X-100, and blocked for 30 min with 3% BSA. Primary and secondary antibodies were incubated in 0.3% BSA. A 15-min fixation with 10% trichloroacetic acid in water was used for phospho-specific antibodies (44). Neurons were examined with an Olympus IX81 motorized inverted microscope (×40 U PLAN Fluorite and ×60 U PLAN S-APO oil objective lenses) with a CoolSnap 4K camera (Photometrics) and a Zeiss LSM780 confocal microscope (×63/1.40 oil Plan-Apochromat) with 488-nm argon and 561-nm DPSS lasers and a GaAsP detector. Pearson’s correlation coefficient and fluorescence intensity quantification were measured with Metamorph software.
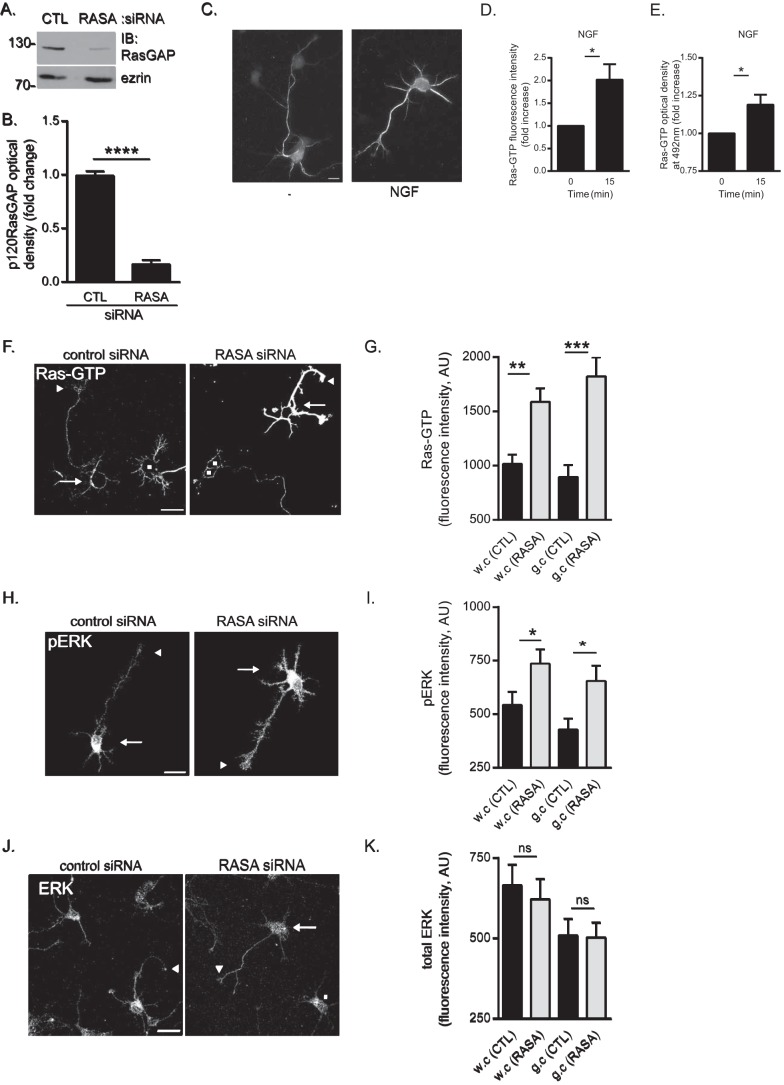
p120RasGAP is required to maintain basal Ras and ERK activities in cortical neurons. Control (CTL) or p120RasGAP (RASA) siRNA was electroporated in neurons at 0 DIV with pGFP as a transfection reporter plasmid. A, total cell lysates were resolved by SDS-PAGE and immunoblotted (IB) with antibodies against p120RasGAP and ezrin as a loading control. B, quantitative densitometry of A represented as the -fold change (mean ± S.E.) relative to control siRNA measured in 10 independent experiments (unpaired Student’s t test; ****, p < 0.0001). C, cortical neurons were stimulated with NGF (100 ng/ml) or left unstimulated (−) for 15 min. Neurons were immunostained with anti-Ras-GTP antibodies. Scale bar = 10 μm. D, Ras-GTP fluorescence intensity and the -fold increase (mean ± S.E.) relative to unstimulated control neurons was measured in at least three independent experiments (n > 50 neurons/condition; unpaired Student’s t test; *, p < 0.05). E, the levels of Ras-GTP in each cell lysate were evaluated by G-LISA assay by measuring the absorbance at 492 nm, which is represented as the -fold change (mean ± S.E.) relative to the unstimulated lysate (0 min) in at least three independent experiments (unpaired Student’s t test; *, p < 0.05). F, neurons were immunostained with anti-Ras-GTP antibodies. Arrows indicate cell bodies, arrowheads indicate growth cones of GFP-expressing neurons, and squares represent untransfected neurons. Scale bar = 50 μm. G, the Ras-GTP fluorescence intensity (arbitrary units (AU), mean ± S.E.) of GFP-expressing neurons in F was measured in whole cells (w.c) and growth cones (g.c) in three independent experiments (n = 31, 32, 31, and 32 neurons; two-way ANOVA, Fisher’s least significant difference post test; **, p < 0.0004; ***, p < 0.0001). H, neurons were immunostained with antibodies against pERK. Arrows indicate cell bodies, and arrowheads indicate growth cones. Scale bar = 50 μm. I, pERK fluorescence intensity (mean ± S.E.) of GFP-expressing neurons in H was measured in whole cells and growth cones in three independent experiments (n = 35, 36, 30, and 35 neurons; two-way ANOVA, Fisher’s least significant difference post test; *, p < 0.05). J, neurons were immunostained with antibodies against ERK. Arrows and arrowheads indicate cell bodies and growth cones of GFP-expressing neurons, respectively, and squares indicate untransfected neurons. Scale bar = 50 μm. K, the total ERK fluorescence intensity (mean ± S.E.) of GFP-expressing neurons in J was measured in whole cells and growth cones (n = 41, 38, 41, and 38 neurons) in three independent experiments (two-way ANOVA, Tukey’s post test; ns, not significant).
Immunocytochemistry
For immunoprecipitation assay, cells were fixed with 4% paraformaldehyde and permeabilized with 0.1% Triton X-100 in phosphate-buffered saline (PBS). and cells were blocked with 10% FBS and with 10% NP-40. Following fixation and blocking, cells were incubated at 4 °C overnight with the primary antibody in PBS with 1% bovine serum albumin (BSA) and 0.1% Triton X-100. Cells were visualized using anti-Rabbit or anti-Mouse Alexa Flour 488 or 546 (Molecular Probes, Seoul, Korea) Nuclei were counterstained with DAPI (Sigma). Stained cells were observed with a fluorescence microscope (Olympus IX71).
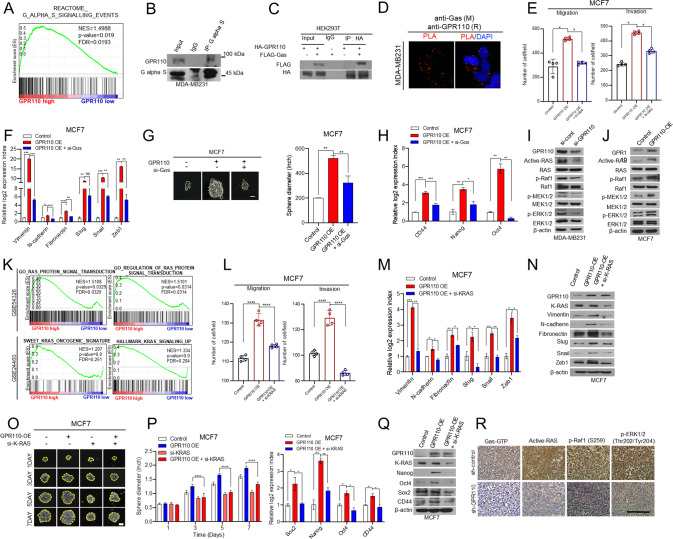
A GESA analysis revealed that GPR110 expression was positively correlated with the Gαs signaling (GSEA12093). B Co-immunoprecipitation with Gas antibody and western blot analysis to check the interaction between Gas and GPR110 in MDA-MB231. C Co-Ip assay to analyze GPR110 and Gαs interaction in HEK293T cells. D Representative images and quantification of in situ PLA showing the interaction between Gas and GPR110. Scale bar = 100 μm. E The invasive and migrated cell numbers were assessed in GPR110 expression alone or together with Gαs expression in MCF7 cells. F qRT-PCR analysis of EMT markers and regulators using the same rescue experiments. G Sphere forming assay were assessed in GPR110 expression alone or together with Gαs expression in MCF7 cells. H qRT-PCR analysis of CSC regulators using the same rescue experiments condition. I, J Western blotting analysis to assess active RAS signaling pathway (p-RAF, p-MEK, p-ERK) using GPR11-silencing MDA-MB231 cells or GPR110-overexpressing MCF7 cells. K GSEA of RAS protein signal transduction signature and KRAS oncogene signature to GPR110 expression in breast cancer patients (GSE54326, GSE24460). L The invasive and migrated cell numbers were assessed in GPR110 expression alone or together with K-Ras expression in MCF7 cells. M, N Western blotting analysis and qRT-PCR analysis of EMT markers and regulators using the same rescue experiments condition. O Sphere forming assay was assessed in GPR110 expression alone or together with K-Ras expression in MCF7 cells (left) and the graph showed the size of spheres formed (right). P, Q Western blotting analysis and qRT-PCR analysis of CSC regulators using the same rescue experiments condition. R IHC analysis of GTP-Gas, Active-RAS, p-RAF, and p-ERK in xenograft tumor of mice. Scale bar = 100 μm. *p < 0.05, **p < 0.001, ***p = 0.0001 and ****p < 0.0001; ns not significant; determined by two-tailed Student’s t test (95% confidence interval).
Immunostaining
Mice were transcardially perfused with 4% paraformaldehyde and brains were kept in 30% sucrose solution. Coronal sections of 40 µm width from the mice brain were taken by cryostat and immunostaining for TH was performed as described earlier [28]. In case of monkeys, animals were anesthetized with pentobarbital (25 mg/kg i.v.) and sacrificed by perfusion with 0.9% saline. Brain was removed from each animal and kept in ice cold saline and further slabbed using monkey brain slicer. Next the tissue slabs were immersed in Zamboni fixative and after that kept in 30% sucrose solution. Sections of 40 µm thickness were taken from the tissue slabs corresponding to midbrain and caudate-putamen region using microtome. The sections were stained for multiple immunostaining using antibodies for TH (1:1000), Iba1 (1:1000), GFAP (1:1000), iNOS (1:500), GTP- p21Ras (1:200), phospho-p65 (1:500) and IL-1β (1:200). For immunofluorescence analysis, sections were incubated with Cy2 or Cy5-labelled secondary antibodies, whereas for immunohistochemistry of TH, the staining was developed by using diaminobenzidine (DAB)/H2O2 (DAB Kit; Vector Laboratories) as described previously [25, 41]. Counting of TH neurons in SN of monkey brains was performed using STEREO INVESTIGATOR software (MicroBrightfield, Williston, VT) having an optical fractionators. Quantification of TH fiber density in the striatum was carried out as described earlier [25, 41].
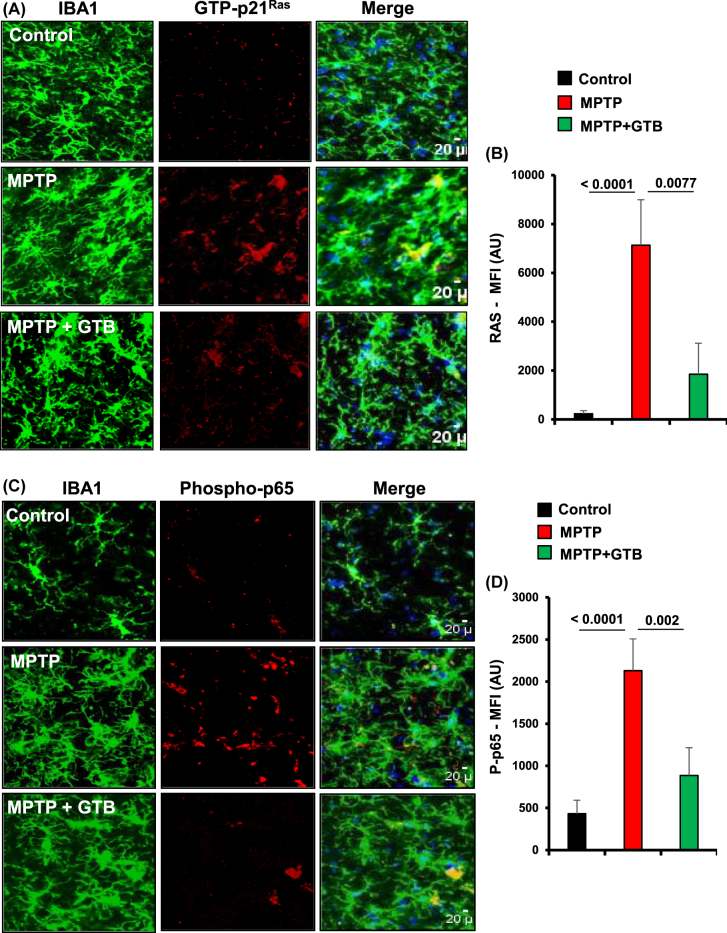
GTB treatment prevents the activation of p21Ras and NF-κB in vivo in the nigra of hemiparkinsonian monkeys. Naïve female rhesus monkeys received a right intracarotid injection of MPTP. After 7 d of injection, monkeys displaying classical parkinsonian postures received GTB (50 mg/kg body wt/d) orally via banana. After 30 d of treatment, nigral sections were double-labelled for Iba1 and GTP-p21Ras
(A) and Iba1 with phospho-p65 (C). Mean fluorescence intensity (MFI) analyses of GTP-p21Ras (B) and phospho-p65 (D) were performed using ImageJ. At least two different sections from each brain were considered for the MFI analyses. One-way ANOVA followed by Bonferroni multiple comparison tests was performed to determine statistical significance. **p<0.01 and ***p<0.001 indicate significance compared to respective groups. Data are presented as mean ± SEM of four monkeys per group.
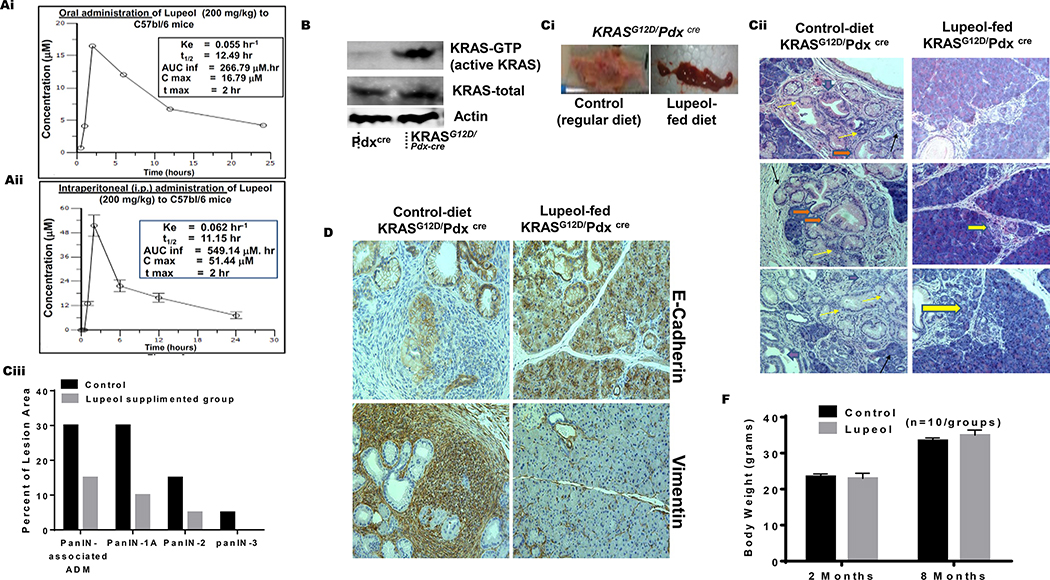
Lupeol inhibits development of PanIN in KRASG12D/Pdxcre transgenic mice.
(Ai-ii) Graphs show 24 h pharmacokinetic profile of Lupeol in mice following 200 mg/kg oral and intraperitoneal administration. Inset in Figures Ai-ii shows pharmacokinetic profile (Cmax = Maximum plasma concentration; Tmax = Time to maximum concentration; AUClast = Area under the curve from time 0 to 24 hrs. AUCinf = Area under the curve from time 0 to infinity). (B) immunoblot image shows the pancreatic KRAS-GTP levels in Pdxcre and KRASG12D/Pdx-cre mice (Ci) Picto-micrographs show the pancreatic morphology in control and Lupeol-fed KRASG12D/Pdxcre mice. (Cii) Representative H&E-stained images of pancreatic acinar-to-ductal metaplasia from a placebo and Lupeol-fed KRASG12D/Pdx-cre mice at 8 months of age. (Ciii) Histogram shows the quantification of mPanIN 1A mPanIN 2A and mPanIN 3 lesions in KRASG12D/Pdxcre control and Lupeol-fed mice (D) Pictures show the EMT phenotype markers E-cadherin (epithelial) and vimentin (mesenchymal) in pancreatic tissues of control and Lupeol-fed mice. (F) Histogram shows the effect of Lupeol treatment on the body weight in mice.
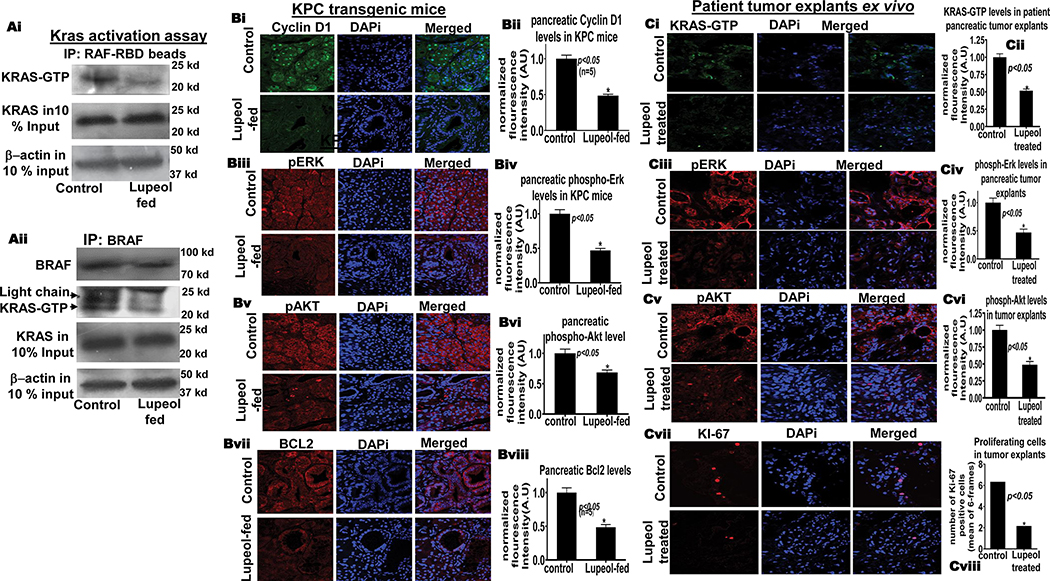
Lupeol reduces KRAS-GTP in KRASG12D/Pdxcre mice and patient tumor explants ex-vivo.
(Ai) Immunoblot image shows KRAS-GTP levels in pancreatic tissues KRASG12D/Pdx-cre mice as assessed of GST-Raf-RBD pull-down assay. (Aii) Immunoblot image shows KRAS-GTP levels in pancreatic tissues of control and Lupeol-fed mice by using BRAF-specific immunoprecipitation. (B) Immunofluorescence-microscopy images and respective histograms show the KRAS-GTP level and KRAS-downstream targets in control and Lupeol-fed mice. (C) Immunofluorescence-microscopy images and respective histograms show the (Ci-vi) KRAS-GTP level and KRAS-downstream targets (Cvii-viii) proliferation marker Ki67 staining in control and Lupeol-treated human pancreatic tumors (explant/PDX) ex vivo.
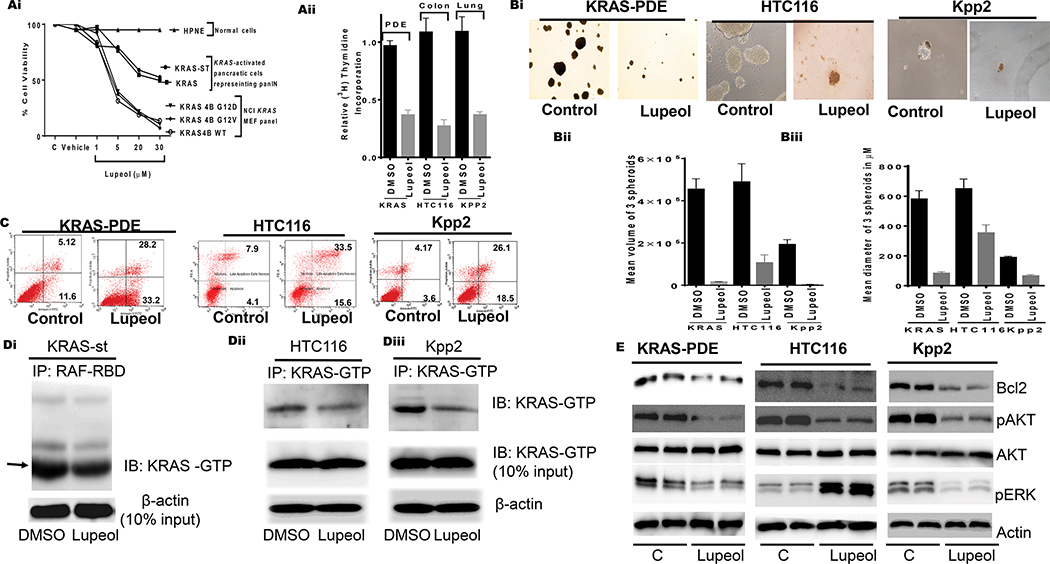
Effect of Lupeol on growth proliferation, apoptosis, 3-dimensional spheroids, KRAS-GTP and KRAS downstream targets.
(Ai) Shows growth of normal, KRAS activated pancreatic cells representing PanIN and MEF having KRAS-G12D mutation. (Aiii) Histogram shows the rate of proliferation (3H[thymidine-uptake) of human pancreatic (KRAS-st), human colon (HTC116) and murine lung (KPP2). (Bi) microphotographs show the effect of Lupeol on prostatospheroids formation of KRAS-activated cells. (Bi-ii) Bar graphs show quantification spheroids in terms of volume and dimeter. (C) FACS analysis image shows the effect of Lupeol on Apoptosis in cells. (Di) immunoblot image shows KRAS-GTP level in pancreatic KRASst cells as assessed by RAF-RBD pull-down assay. (Dii-iii) immunoblot images show KRAS-GTP levels in colon and lung cells by KRAS-GTP-specific immunoprecipitation assays. (E) immunoblot image shows the KRAS-downstream targets in KRAS-activated cells.
Immunoblotting
Proteins were extracted from cells or frozen tissue; the samples were run on SDS polyacrylamide gels of 8–15% depending on molecular weight of protein of interest and transferred on to nitrocellulose membrane. Following transfer the membranes were probed with primary antibodies for K-Ras (OP24, Calbiochem, EMD Millipore, MA, USA), GAPDH (Ma3374, Millipore), Jag 1 (sc-8303, Santa Cruz, CA, USA), pErK (4370, Cell Signaling, MA, USA), α-SMA (Ab5694, Abcam), Active Ras-GTP Monoclonal Antibody (26909, NewEast Bioscience) and subsequently probed with the appropriate secondary anti-mouse IgG or anti-rabbit IgG. Densitometry was performed using ImageJ software provided by NIH.
Histology
Tissue was fixed in buffered formalin for 24 hours, embedded in paraffin, cut into 4 µm-thick sections and stained with H&E or special stains.
Special stains
Sections stained using the picro-Mallory trichrome (PMT) and picrosirius red (PSR) techniques were used to assess fibrosis. All sections were viewed under bright light. The degree of cortical fibrosis was scored using NIS-elements-Br 3.10, measuring the blue and red areas respectively in a randomized and blinded manner. The slides were quantified using a 200x quantification and the number of fields quantified depended on the stain in question. 10, 15, 20, and 25 fields per section were measured for the first three sections assessed from each stain. The average for each was compared, and when an increase in field number no longer changed the average by more than 10%, it was deemed an adequate number of fields for each section for that stain. The minimum number of fields per section sections for a stain was 10 with a maximum of 20.
Immunohistochemistry
Sections were mounted on polylysine-coated slides, baked at 40 °C overnight and deparaffinised. Antigen retrieval was performed by pressure-cooking in a citrate buffer (pH6) as required. Antibodies used were directed against modified oligonucleotides (supplied by Ionis Pharmaceuticals, rabbit polyclonal), α-smooth muscle actin (α-SMA) (A2547; Sigma-Aldrich Co. Ltd.). They were subsequently detected with a secondary ImmPRESS polymer reagents and DAB substrate (brown) (Vector Labs, California, US).
K-Ras expression is upregulated in chronic folic acid nephropathy (CFAN) and K-Ras activation is increased in CFAN and unilateral ureteric obstruction. Male CD1 mice received 2 intravenous doses of 125 mg/kg of folic acid (FA) or normal saline (control). Male Wistar rats underwent laparotomy followed by unilateral ureteric obstruction. Sham operated rats underwent laparotomy alone. (a) Total kidney mRNA was extracted from mice with chronic folic acid nephropathy (CFAN) (grey columns) or age-matched untreated controls (white columns) from different time periods and subjected to reverse transcription followed by quantitative PCR for K-Ras expression normalised to GAPDH. Each point or band represents a single animal, 8–16 animals in each treatment group. (b) Total Kidney lysate from CD1 mice with and without CFAN was subjected to immunoprecipitation (IP) followed by western blotting for K-Ras. The total cell lysate from the (IP) was then immunoblotted for GAPDH as an IP control. The densitometry ratio of K-Ras to GAPDH contains data from 4 untreated and 5 CFAN mice (Supplementary Fig. S2). (c) Total Kidney lysate from rats 16 days post UUO was subjected to western blotting for phosphorylated ERK 41/42 and compared with total ERK. A more complete image of this blot is shown in Supplementary Fig. S1. (d) Kidney sections from mice with CFAN (or untreated controls) were stained for GTP-bound (activated) Ras (left hand column) or phospho-ERK (right hand column). The tissue expression of these targets is seen as brown stain in the panels.
Immunostaining and confocal analysis
Macrophages were detached as described earlier and plated in 18-mm glass coverslips precoated with fibronectin or fibrinogen. Cells were fixed with 4% (w/v) paraformaldehyde for 30 min and, after washing with PBS and quenching with 50 mM NH4Cl, permeabilized with PBS-0.1% Triton X-100. After quenching with 1% BSA for 30 min, cells were stained with primary Abs for 1 h, washed with PBS, and then stained with secondary Abs and rhodamine-phalloidin for 30 min, followed by DAPI (Sigma Aldrich) for 10 min. Images of the ventral, substrate-adherent face of the cell were collected using the SP5 confocal microscope from Leica Microsystems (Mannheim, Germany) with a 63× objective (HCX PL APO λ blue 1.4NA OIL). Images were processed for brightness and contrast with Adobe Photoshop.
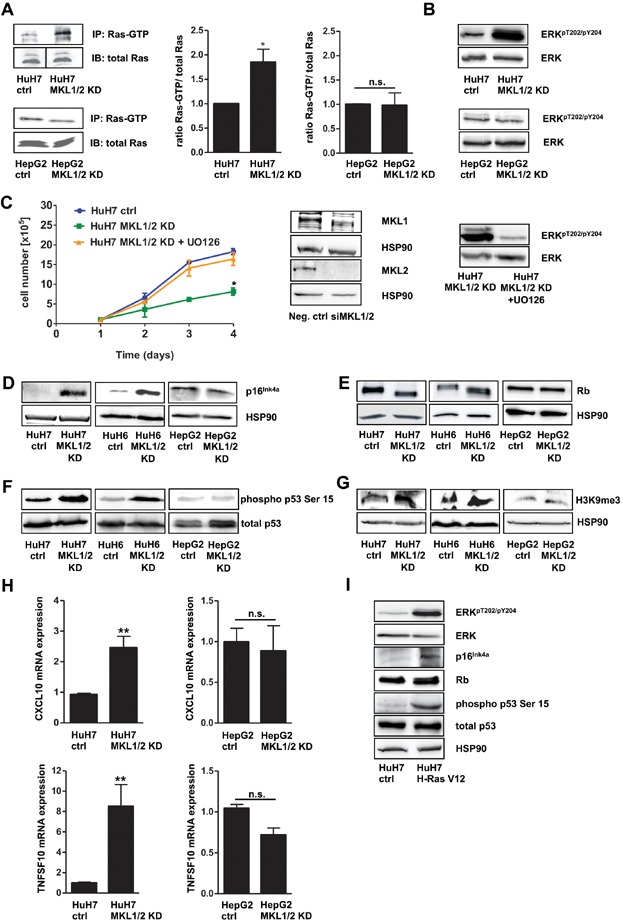
- HuH7, HuH7 MKL1/2 KD, HepG2 and HepG2 MKL1/2 KD cells were immunoprecipitated with anti-active Ras antibody and immunoblotted with anti-Ras antibody. Equal amounts of lysates were directly immunoblotted with anti-Ras antibody. The black line delineates a boundary caused by juxtaposing lanes that were non-adjacent in the same gel. The relative ratio of active Ras versus total Ras was quantitated and graphically depicted on the right. Values are mean ± SD; *p = 0.046.
- Lysates of HuH7 and HepG2 cells with control shRNA or MKL1/2 shRNA were immunoblotted with anti-ERKpT202/pY204 and total anti-ERK antibodies.
- Neg. ctrl siRNA or MKL1/2 siRNA (50 nM) expressing HuH7 cells, treated with or without 10 µM U0126 were counted daily for 4 days. Values are mean ± SEM (n = 3); *p = 0.02. Lysates of the indicated cells were subjected to immunoblotting using anti-MKL1, anti-MKL2, anti-HSP90, anti-ERKpT202/pY204 and total anti-ERK antibodies.
- Lysates of the indicated cells were immunoblotted with anti-p16Ink4a and anti-HSP90 antibodies.
- Lysates of the indicated cells were immunoblotted with anti-Rb and anti-HSP90 antibodies.
- Lysates of the indicated cells were immunoblotted with anti-phospho p53 serine 15 and total anti-p53 antibodies.
- Lysates of the indicated cells were immunoblotted with anti-H3K9me3 and anti-HSP90 antibodies.
- Relative CXCL10 and TNFSF10 mRNA expression of HuH7 and HepG2 cells was measured by qRT-PCR. Values are mean ± SD (n = 3); **p = 0.0034; **p = 0.0079.
- HuH7 cells were infected with pBabe H-Ras V12 or pBabe control vector. At day 5 posttransduction, cells were lysed and subjected to immunoblotting using anti-ERKpT202/pY204, total anti-ERK, anti-p16Ink4a, anti-phospho p53 serine 15, total anti-p53 and anti-HSP90 antibodies.