Email: info@neweastbio.com   |  Call: 6109452007

Published Pictures for 26907 Gαo-GTP mAb

2.4. Immunoprecipitation of Activated Gα o Subunit

The Gα o activation assay kit from New East Bioscience (#80901, King of Prussia, PA) was used. The protocol recommended by the manufacturer was employed with modifications. Briefly, neurons at 14 days in vitro (DIV) (seeded at 900,000 cells/well) were treated with 1 μM Mas-7 for 5 or 30 min. Then, the cells were lysed with 0.5 mL 1x kit buffer (#30303) and centrifuged at 12,000 ×g 4°C for 10 min. The supernatants were incubated with 1 μL mouse monoclonal antibody specific for Gα o bound to GTP (active form) (#26907) and 20 μL A/G agarose beads (#30301) for 2 h at 4°C with orbital rotation. As a positive control, untreated neurons were lysed and then incubated with 10 mM GTPγS (#30302) and 10 mM MgCl2 for 90 min at RT, and as a negative control, the lysed neurons were incubated with 10 mM GDP (#30304) and 10 mM MgCl2. Later, the lysates were washed 3 times and the beads were suspended in 20 μL Laemmli 2x loading buffer and boiled for 5 min. The total level of Gα o was detected by immunoblotting with a polyclonal anti-Gα o antibody (#21015, 1 : 1000).

Figure 1  Mas-7 activates the Gα o subunit and increases the intracellular Ca2+ concentration in hippocampal neurons.

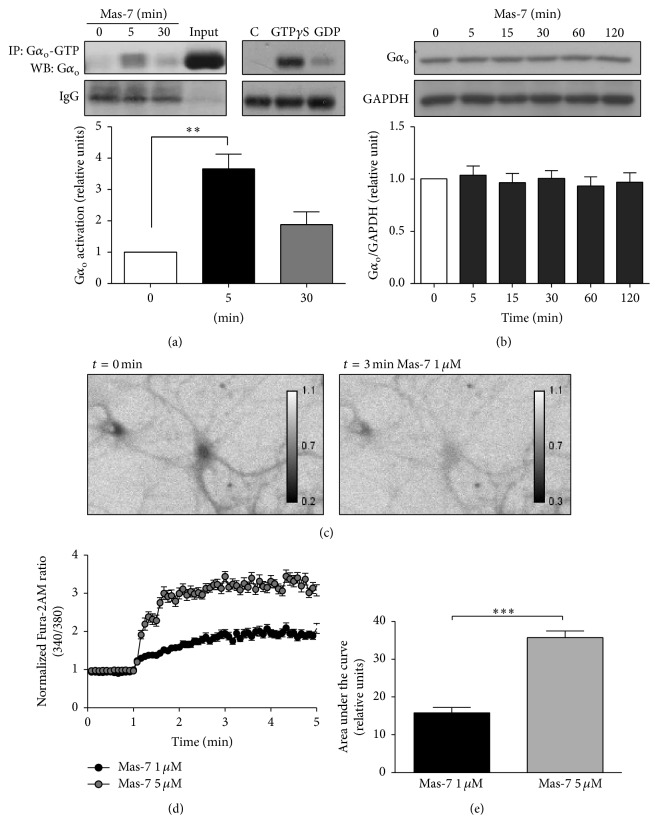
(a) Left panel, 14 DIV hippocampal neurons were stimulated with 1 μM Mas-7 for 0, 5, or 30 min. The neurons were lysed and incubated with anti-Gα o-GTP for 2 h and then analyzed by immunoblotting using an anti-Gα o antibody (n = 4). The input lane corresponds to a lysate sample before the immunoprecipitation. ∗∗ p < 0.01. Right panel, lysates from untreated (control) hippocampal neurons were incubated with GTPγS as a positive control or with GDP as a negative control for 90 min at RT. Then, the Gα o-GTP was immunoprecipitated and analyzed by western blotting to determine the total level of Gα o. The IgG band shows that an equal amount of antibody was used for the immunoprecipitation. (b) Representative western blot and quantification of the total level of Gα o in 14 DIV neurons incubated for different periods of time with 1 μM Mas-7. GAPDH was used as a loading control (n = 4). (c) Ratio images (340/380) of the Fura-2AM probe from hippocampal neurons under basal conditions (t = 0) or after 3 min of 1 μM Mas-7 treatment. (d) Quantification of measurements of the intracellular Ca2+ increase in hippocampal neurons bathed in a Ca2+-free solution with different concentrations of Mas-7 (n = 3, 70–79 neurons, each condition). (e) Area under the curve of the Ca2+ increase after Mas-7 treatment. ∗∗∗ p < 0.001.

2.10. Gαo Activation Assay

The activity of Gao was determined using Gαo Activation Assay Kit (NewEast Biosciences, Wuhan, China) according to the manufacturer’s instructions.

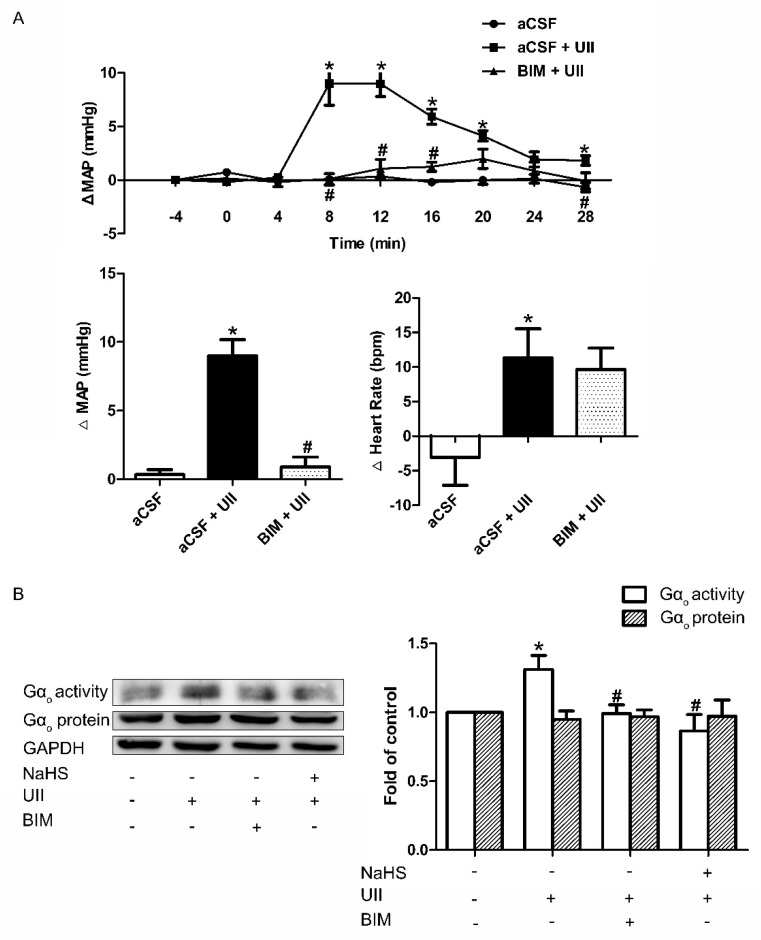
Inhibitory role of NaHS on UII−induced Gαo activation. Time course of MAP and the maximal changes in MAP and HR in response to microinjection of aCSF, aCSF + UII, or BIM + UII into the RVLM of SD rats

(A). The change in the activity and protein level of Gαo after pretreatment with NaHS or BIM for 30 min before UII was used (B). Densitometric analysis of the viability of Gαo (B). Mean ± SEM. n = 6. * p < 0.05 vs. aCSF group; # p < 0.05 vs. aCSF + UII group.

Activation of Gαo by KDELR

The ability of the antibody against active Gαo to detect GTP-loaded Gαo was determined by an immunoprecipitation assay. N2a cells expressing Gαo were harvested using the Assay-lysis buffer (20 mM Tris-HCl, pH 7.4, 150 mM NaCl, 1 mM EDTA, 10 mM MgCl2 and 1% Triton X-100) supplemented with protease inhibitors, the cleared lysate was split in two equal parts and incubated for 90 min at 30°C in the presence of 1 mM GDP or 100 μM GTPγS. Then, the antibody and protein A/G beads were added to each sample and rotated for 30 min at 4°C. Beads were washed with Assay-lysis buffer and finally prepared for SDS-PAGE and WB analysis. The specificity of the anti-active Gαo antibody was parallely tested by immunostaining performed as described above (Immunofluorescence and microscopy) and using a Cy3-coupled secondary antibody. Stained N2a cells expressing the Gαo-GFP WT or Q205L mutant we recorded using the same confocal settings to assess fluorescence intensity.
To characterize the ssBFP and ssBFPKDEL constructs, N2a cells were separately co-transfected with Gαo-GFP and one of the constructs for 6 hr, the transfection media was exchanged by fresh complete media, and cells were incubated by additional 18 hr at normal culture conditions. Then, media were collected and cell extracts prepared using Lysis buffer as described above (Biochemical analyses). Cleared media and cell extracts were prepared for SDS-PAGE, and WB analysis was done against GFP and α-tubulin. A ponceau S solution was used as loading control for culture media. The retention at the ER of the ssBFPKDEL construct was determined by confocal microscopy in transfected N2a cells.
Then, N2a cells co-expressing Gαo-GFP and ssBFPKDEL or control ssBFP were immunostained using an antibody against GTP-loaded Gαo and a Cy3-conjugated secondary antibody to determine the levels of Gαo activation. The fluorescence mean intensities derived from the Cy3 and GFP fluorophores were measured from confocal images at the PM and perinuclear regions marked by Gαo-GFP, and their ratio values at each compartment were used to determine the GTP-loading of Gαo over total level of the protein. A similar analysis was done in N2a cells co-transfected with Gαo-GFP and KDELR-GST or control pcDNA3.1+ plasmids. At least 50 cells per condition were analyzed and Student’s t test was used for statistical analysis.
 

Figure S6 Gαo Does Not Translocate From the PM to the Golgi upon Activation, Related to  and 


(K) Western blot of the Gαo immunoprecipitation (IP) using the Ab against active Gαo (Gαo-GTP). N2a cell extracts expressing non-tagged Gαo were pre-incubated with GDP or GTPγS previous to the IP. The Ab against total Gαo used for detection revealed the specificity of the Gαo-GTP Ab toward GTPγS-loaded Gαo (arrowhead).
(L) N2a cells expressing the wild-type (top) or the constitutive active Q205L mutant (bottom) of a GFP-fusion of Gαo (Gαo-GFP) were immunostained using the Gαo-GTP Ab. Confocal images recorded using equal settings confirmed the specificity of the Gαo-GTP Ab for the detection of Gαo on its active conformation. Scale bar, 10 μm.

Activation of Gαo by KDELR

The ability of the antibody against active Gαo to detect GTP-loaded Gαo was determined by an immunoprecipitation assay. N2a cells expressing Gαo were harvested using the Assay-lysis buffer (20 mM Tris-HCl, pH 7.4, 150 mM NaCl, 1 mM EDTA, 10 mM MgCl2 and 1% Triton X-100) supplemented with protease inhibitors, the cleared lysate was split in two equal parts and incubated for 90 min at 30°C in the presence of 1 mM GDP or 100 μM GTPγS. Then, the antibody and protein A/G beads were added to each sample and rotated for 30 min at 4°C. Beads were washed with Assay-lysis buffer and finally prepared for SDS-PAGE and WB analysis. The specificity of the anti-active Gαo antibody was parallely tested by immunostaining performed as described above (Immunofluorescence and microscopy) and using a Cy3-coupled secondary antibody. Stained N2a cells expressing the Gαo-GFP WT or Q205L mutant we recorded using the same confocal settings to assess fluorescence intensity.
To characterize the ssBFP and ssBFPKDEL constructs, N2a cells were separately co-transfected with Gαo-GFP and one of the constructs for 6 hr, the transfection media was exchanged by fresh complete media, and cells were incubated by additional 18 hr at normal culture conditions. Then, media were collected and cell extracts prepared using Lysis buffer as described above (Biochemical analyses). Cleared media and cell extracts were prepared for SDS-PAGE, and WB analysis was done against GFP and α-tubulin. A ponceau S solution was used as loading control for culture media. The retention at the ER of the ssBFPKDEL construct was determined by confocal microscopy in transfected N2a cells.
Then, N2a cells co-expressing Gαo-GFP and ssBFPKDEL or control ssBFP were immunostained using an antibody against GTP-loaded Gαo and a Cy3-conjugated secondary antibody to determine the levels of Gαo activation. The fluorescence mean intensities derived from the Cy3 and GFP fluorophores were measured from confocal images at the PM and perinuclear regions marked by Gαo-GFP, and their ratio values at each compartment were used to determine the GTP-loading of Gαo over total level of the protein. A similar analysis was done in N2a cells co-transfected with Gαo-GFP and KDELR-GST or control pcDNA3.1+ plasmids. At least 50 cells per condition were analyzed and Student’s t test was used for statistical analysis.
 

Figure S7 KDELR Activates Gαo at the Golgi

(A and B) Overexpression of KDELR increased Gαo activity at the Golgi region in N2a cells (A). Active Gαo-GFP was detected by immunostaining against GTP-loaded Gαo (Gαo-GTP). Marked regions are magnified (right, as in E). Mean fluorescence intensity ratios of active versus total Gαo calculated at the PM and Golgi (B).

Activation of Gαo by KDELR

The ability of the antibody against active Gαo to detect GTP-loaded Gαo was determined by an immunoprecipitation assay. N2a cells expressing Gαo were harvested using the Assay-lysis buffer (20 mM Tris-HCl, pH 7.4, 150 mM NaCl, 1 mM EDTA, 10 mM MgCl2 and 1% Triton X-100) supplemented with protease inhibitors, the cleared lysate was split in two equal parts and incubated for 90 min at 30°C in the presence of 1 mM GDP or 100 μM GTPγS. Then, the antibody and protein A/G beads were added to each sample and rotated for 30 min at 4°C. Beads were washed with Assay-lysis buffer and finally prepared for SDS-PAGE and WB analysis. The specificity of the anti-active Gαo antibody was parallely tested by immunostaining performed as described above (Immunofluorescence and microscopy) and using a Cy3-coupled secondary antibody. Stained N2a cells expressing the Gαo-GFP WT or Q205L mutant we recorded using the same confocal settings to assess fluorescence intensity.
To characterize the ssBFP and ssBFPKDEL constructs, N2a cells were separately co-transfected with Gαo-GFP and one of the constructs for 6 hr, the transfection media was exchanged by fresh complete media, and cells were incubated by additional 18 hr at normal culture conditions. Then, media were collected and cell extracts prepared using Lysis buffer as described above (Biochemical analyses). Cleared media and cell extracts were prepared for SDS-PAGE, and WB analysis was done against GFP and α-tubulin. A ponceau S solution was used as loading control for culture media. The retention at the ER of the ssBFPKDEL construct was determined by confocal microscopy in transfected N2a cells.
Then, N2a cells co-expressing Gαo-GFP and ssBFPKDEL or control ssBFP were immunostained using an antibody against GTP-loaded Gαo and a Cy3-conjugated secondary antibody to determine the levels of Gαo activation. The fluorescence mean intensities derived from the Cy3 and GFP fluorophores were measured from confocal images at the PM and perinuclear regions marked by Gαo-GFP, and their ratio values at each compartment were used to determine the GTP-loading of Gαo over total level of the protein. A similar analysis was done in N2a cells co-transfected with Gαo-GFP and KDELR-GST or control pcDNA3.1+ plasmids. At least 50 cells per condition were analyzed and Student’s t test was used for statistical analysis.
 

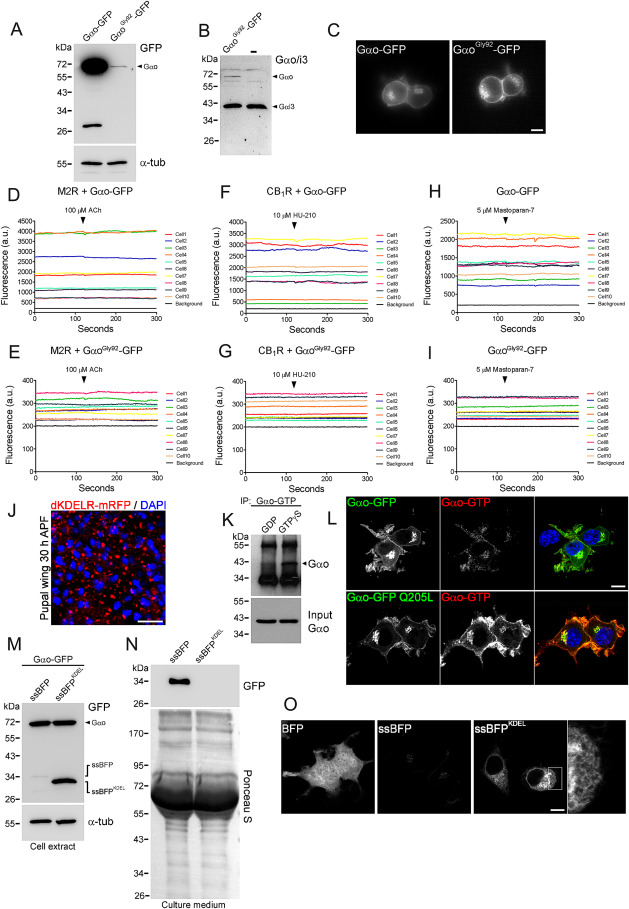
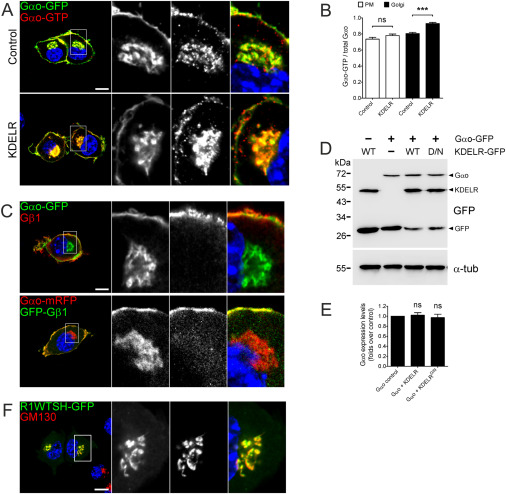
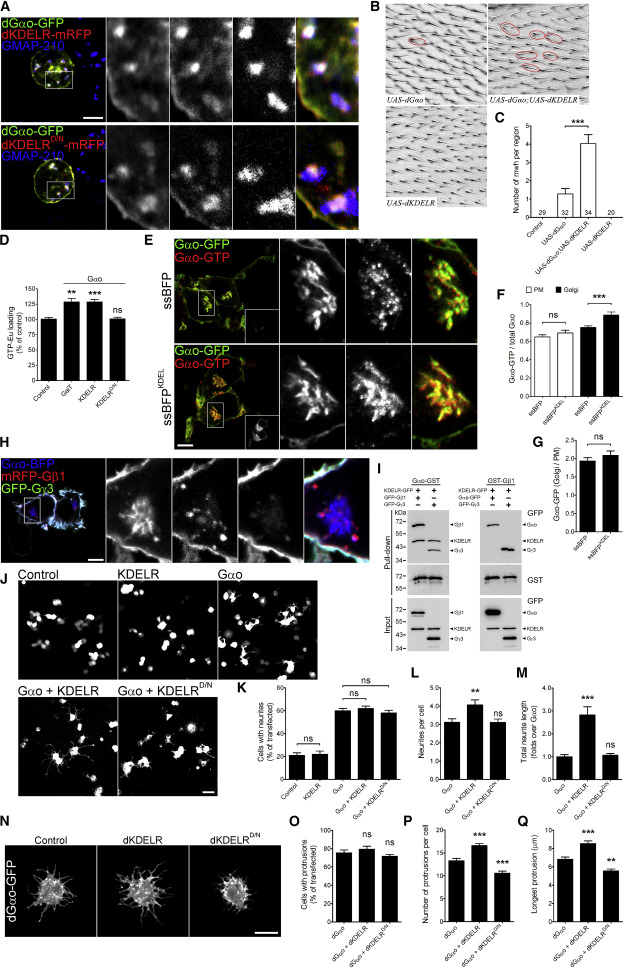
(E–G) Stimulation of KDELR activates Gαo in N2a cells (E). ssBFPKDEL but not control ssBFP stimulates endogenous KDELR. Activated Gαo is detected by Abs against Gαo-GTP. Marked regions are zoomed-in. Mean fluorescence intensity ratios of active versus total Gαo calculated at the PM and Golgi (F) and of total Gαo-GFP at the Golgi versus PM (G). Scale bar, 10 μm.

Immunoprecipitation of Gαi/o Proteins 

We used the Gαo (80901) and Gαi (80301) activation assay kits from New East Biosciences. The cultured hippocampal neurons were seeded at a density of 900,000 cells/well at DIV 14 and were treated with Wnt-5a (300 ng/ml). After treatment, cells were lysed, and the amount of protein was quantified. The same amount of protein was used in each condition for the immunoprecipitation (400 μg) with the specific antibodies that recognize the GTP-bound Gαo or the GTP-bound Gαi proteins according to the manufacturer’s recommended protocol. GTPγS was used as a positive control and was added to the neuronal lysate and incubated for 90 min at room temperature before immunoprecipitation. The total level of protein was detected by immunoblot with the mouse anti-Gαo (1:1000) or mouse anti-Gαi (1:1000) antibodies from the activation kits from New East Bioscience.

For immunoprecipitation of total Gαo hippocampal cultured neurons were seeded at a density of 600,000 cells/well. The neurons were treated with vehicle or Wnt-5a and then lysed. After protein quantification, 400 μg of protein was incubated with 5 μg/ml of mouse anti-Gαo (sc-13532; Santa Cruz Biotechnology) and 20 μl of agarose beads for 1 h at 4 °C with orbital rotation. The 10% of the sample was used as input. Next, the lysates were washed three times and suspended in 20 μl of Laemmli 2× loading buffer. The samples were analyzed by immunoblotting with rabbit anti-Gαo, goat anti-FZD9, and rabbit anti-Gβ1–5 antibodies.

Wnt-5a increases the GDP/GTP exchange of the Gαo subunit, and FZD9 is associated with Gαo in DIV 14 hippocampal neurons. 

A, hippocampal neurons were stimulated with recombinant Wnt-5a for the indicated lengths of time. The lysates were incubated with specific antibodies that recognize Gαo-GTP or Gαi-GTP. As a positive control, untreated hippocampal neuron lysates were incubated with GTPγS for 90 min at room temperature and then incubated with the antibody. The lysates were analyzed by SDS-PAGE and immunoblotting with antibodies that recognize the total levels of Gαo or Gαi (n = 3). The IgG band shows that equal amounts of the Gαo/i-GTP antibodies were used for immunoprecipitation. Left panel, representative blot images. Right panel, blot quantifications. B, DIV 13 or 14 neurons were treated or not with Wnt-5a (30 min), and the lysates were immunoprecipitated with an anti-Gαo antibody and immunoblotted with anti-FZD9 and anti-Gβ1–5 (this antibody labels all five Gβ isoforms) (n = 4) in the same membrane. Left panel, representative blot images. Right panel, blot quantifications. **, p < 0.01; *, p < 0.05. No Ab, no antibody was added; WB, Western blotting; IP, immunoprecipitation.