


Published IP Pictures for 26909 Ras-GTP mAb
Submit Evaluation of RAS activation in detail
We employed the New East Biosciences (Wuhan, China) RAS Activation Assay Kit. The assay principle is based on the use of a configuration-specific anti-RAS-GTP monoclonal antibody to measure active RAS-GTP levels in either cell extracts or in vitro GTPγS loading RAS activation assays. According to your suggestion, we appended a brief explain to the supplemental information as follows:
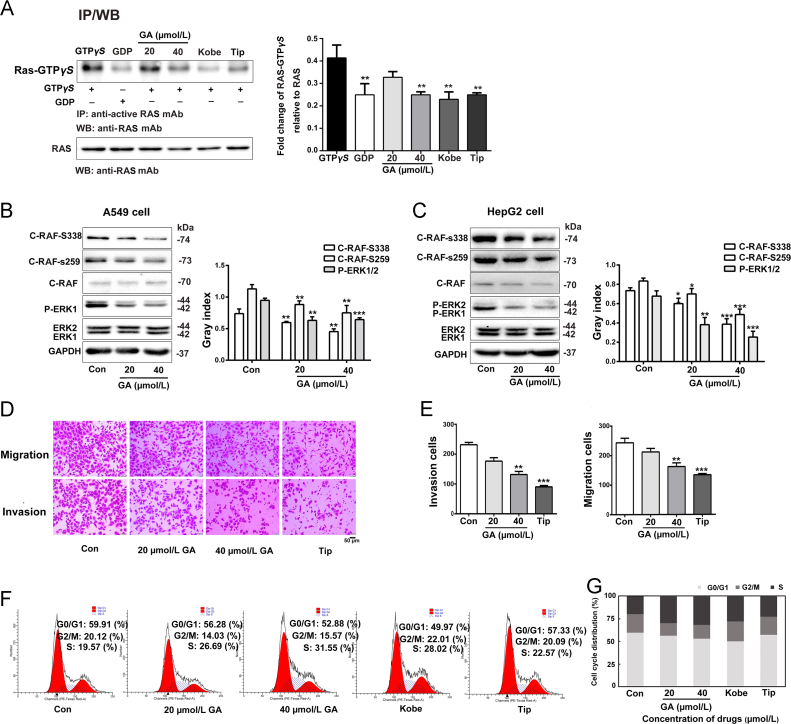
A New East Biosciences (Wuhan, China) RAS Activation Assay Kit was employed to detect active RAS-GTP levels, according to the manufacturer’s instruction. Briefly, approximately 80%–90% confluent cultured cells (10-cm plate) were stimulated with Kobe (20 µmol/L) for 1 h or Tip (10 µmol/L) or GA (20 or 40 µmol/L) for 6 h. Then, the culture media was aspirated, cells were washed twice with ice-cold PBS, and then 500 µL of ice-cold assay/lysis buffer was added to the cells and incubated on ice for 10–20 min. Cells were detached with a cell scraper, and the lysates were clarified by centrifugation for 10 min (12000×g, at 4 °C). GTPγS- and GDP-bound proteins served as positive and negative controls, respectively. Cell extracts were divided into two tubes and 20 µL of 0.5 mol/L EDTA were added. Five microliters of GTPγS were added to the positive control and 5 µL of GDP were added to the negative control. Tubes were incubated at 30 °C for 30 min, and loading was terminated by placing the tubes on ice and adding 60 mmol/L MgCl2. Then, 1 µL of anti-active RAS monoclonal antibody was added to each tube. Twenty microliters of resuspended bead slurry were quickly added to each tube. Then, the tubes were incubated at 4 °C for 1 h with gentle agitation. Beads were pelleted by centrifugation for 1 min at 5,000×g. The supernatant was aspirated and discarded, and the beads were washed 3 times with assay/lysis buffer. After the last wash, all supernatant was removed and the bead pellet was resuspended in 20 µL of SDS-PAGE sample buffer. The tubes were boiled for 5 min prior to SDS-PAGE and Western blotting.
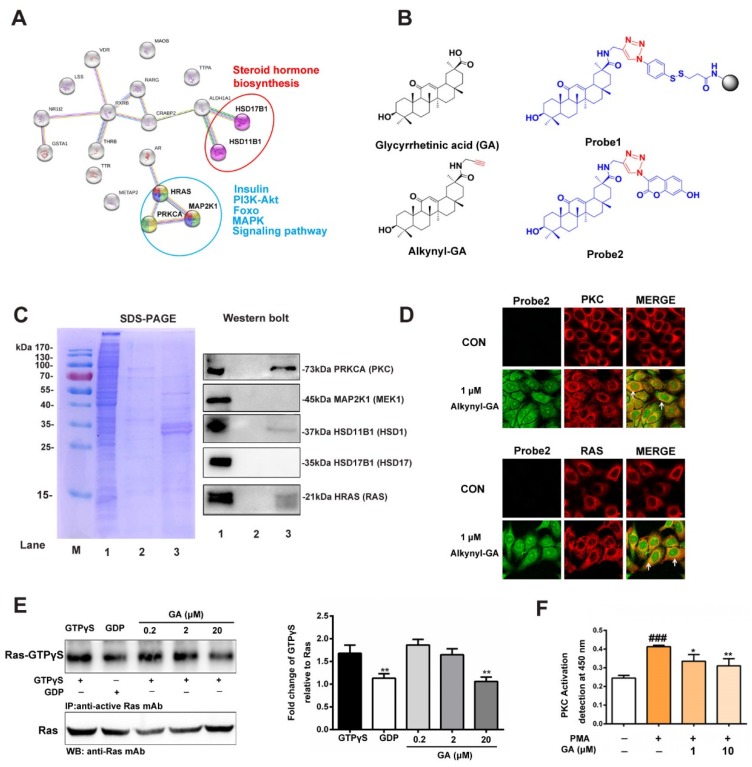
GA inhibits GTP binding and the activation of downstream effectors. (A) GA dose-dependently inhibits GTP binding and the activation of downstream effectors in vitro. (B) and (C) Western blots showing the levels of activated downstream effectors, c-RAF phosphorylated at S338 and S259 and phosphorylated ERK1/2 levels, in A549 cells and HepG2 cells after GA treatment. GAPDH expression was used as an internal control for normalization. The assay was performed three times, Error bars indicate means ± S.D. (*P < 0.05, **P < 0.01, ***P < 0.001 compared to the control). (D) and (E) A549 cells were cultured with 20 or 40 µmol/L GA. Migration (upper panel) and invasion (lower panel) were investigated using Transwell and Matrigel assays (n = 5), scale bar: 50 µm. (F) and (G) PI staining was performed to investigate the effect of GA on the cell cycle. Cells were treated with GA (20 or 40 µmol/L) for 24 h and then stained with PI. GA induced S phase arrest in A549 cells. Histogram shows the percentage of cells in G0/G1, G2/M and S Phase (n = 3).
Ras activity assay
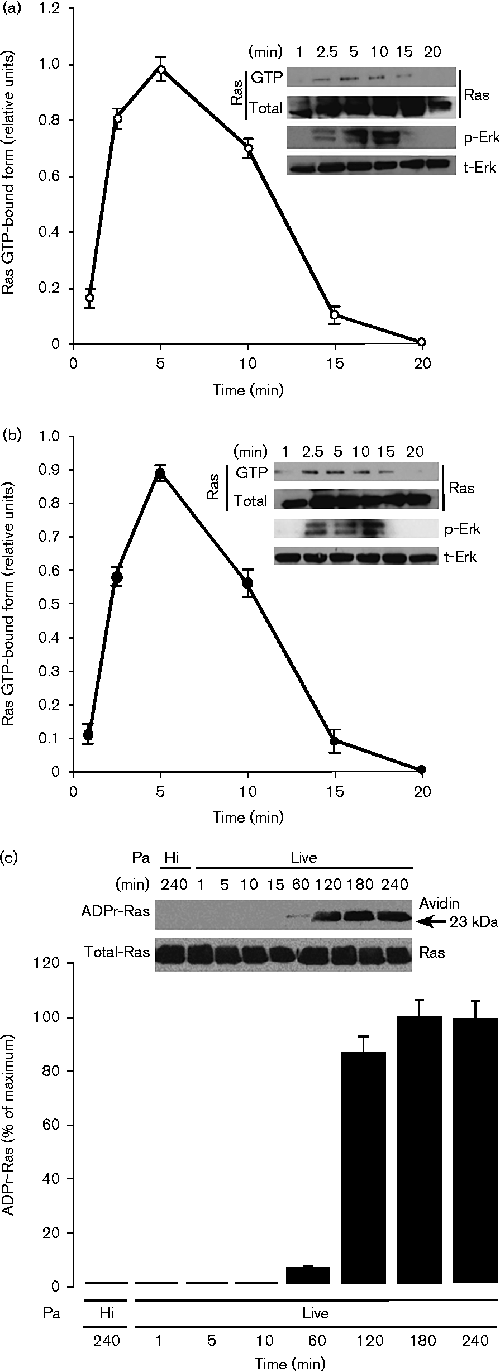
The relative activity of Ras GTPase was assessed by a commercial Ras activation assay kit (NewEast Biosciences, Malvern, PA). Briefly, cells were grown to 70–80% confluency and subsequently lysed with ice-cold buffer containing 10 mM Tris, 100 mM NaCl, 1% Triton X-100, 0.5 mM ethylenediaminetetraacetic acid, 40 mM β-glycerophosphate, 10 mM MgCl2, 1 mM Na3VO4, 10 μg/ml aprotinin, 10 μg/ml leupeptin and 1 mM phenylmethylsulfonyl fluoride. Cellular debris was removed by centrifugation and total protein concentrations was measured by a colorimetric assay method (Bio-Rad, Hercules, CA). Equal amounts (1.0 mg total protein) of lysates were then incubated at 4°C with an antibody that specifically recognizes the active form of H-Ras (Ras-GTP). After 30 min, protein A agarose beads were added and incubated for an additional 30 min. Next, the beads were collected by centrifugation and were washed three times in the lysis buffer. The beads were boiled in protein loading buffer, and the released proteins were resolved on 12% SDS-PAGE gels and were transferred onto an Immobilon-P membrane (Millipore Corporation, Bedford, MA). The presence of H-Ras-GTP was detected using an anti-H-Ras antibody.
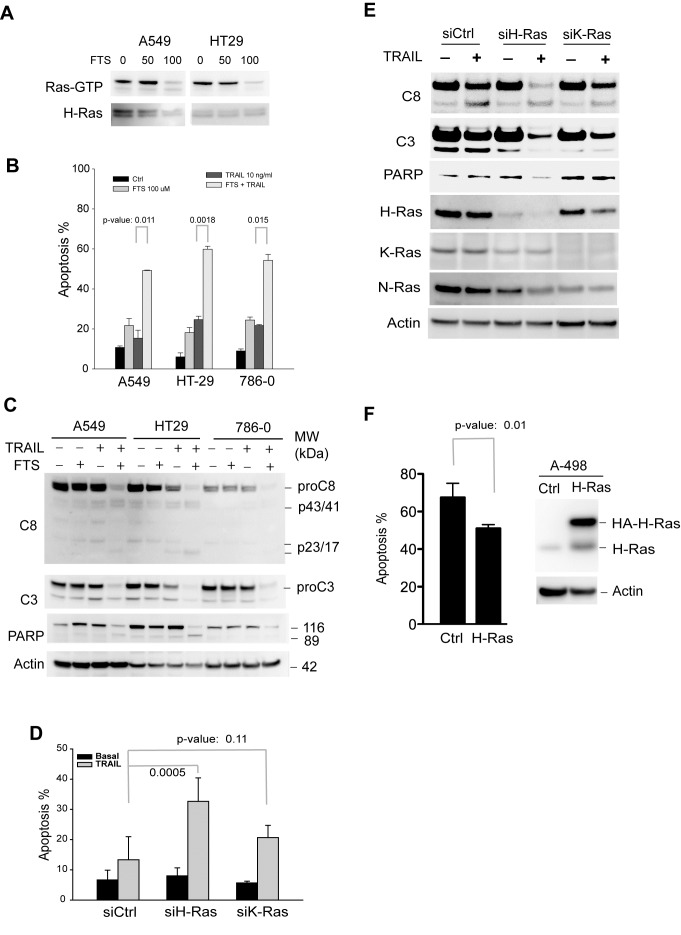
TRAIL-resistant cell lines, A549, A786-0, and HT29, were randomly chosen for these experiments. A, Cells were left untreated or treated at 37°C with (FTS), a pharmacological inhibitor of Ras GTPases, at 50 or 100 μM. After 48 h, cells were harvested and lysed in a buffer. Equal amounts of whole cell lysates were incubated with an antibody specific to the GTP-bound, active form of H-Ras (Ras-GTP). The immunocomplexes were precipitated by protein A agarose beads and blotted using an anti-H-Ras antibody. Equal inputs were confirmed by blotting H-Ras in the whole cell lysates that were used. Ras-GTP was effectively suppressed with 100 μM FTS in 48 h, and therefore this condition was used for all experiments. B & C, FTS increases TRAIL induced apoptosis. The indicated cells were left untreated or treated with FTS at 100 μM for 48 h, and then incubated with 10 ng/mL rhTRAIL for an additional 24 h. The resultant cells were analysed by flow cytometry (B) for apoptosis or by western blotting for cleavage of caspase-3 and caspase-8 (C). D & E, specific isoform knockdown of H-Ras increases TRAIL-induced apoptosis. A549 cells were transiently transfected with a scramble siRNA (siCtrl) or siRNA specific to H-Ras or K-Ras transcript. After 24 h post-transfection, cells were treated with 10 ng/mL rhTRAIL for an additional 24 h. The resultant cells were analysed for apoptosis (D) and caspase cleavage (E). F, A498 cells were transiently transfected with a plasmid encoding wild-type H-Ras. At 24 h post-transfection, cells were treated with 10 ng/mL of TRAIL for additional 6 h and measured for apoptosis by flow cytometry analysis. Shown are representatives of three experiments. The p-values (Student’s t test) indicate a significant difference between the two indicated groups.
4.3. RAS-GTP Level Assay
The level of RAS-GTP was assessed using a RAS pull-down activation assay kit (NewEast Biosciences, Malvern, PA, USA, #81101), according to the manufacturer’s instructions. In brief, cells were cultured in 6-well plates to 70% confluence before transfection. Total cell lysates were collected and incubated with anti-active RAS monoclonal antibody plus protein A/G agarose bead slurry at 4 °C for 1 h with gentle agitation. Agarose beads were resuspended in 20 μL of 2× reducing SDS-PAGE sample buffer and boiled. Precipitated RAS-GTP was detected by Western blot analysis using anti-RAS monoclonal antibody (provided by the kit) according to the manufacturer’s instructions.
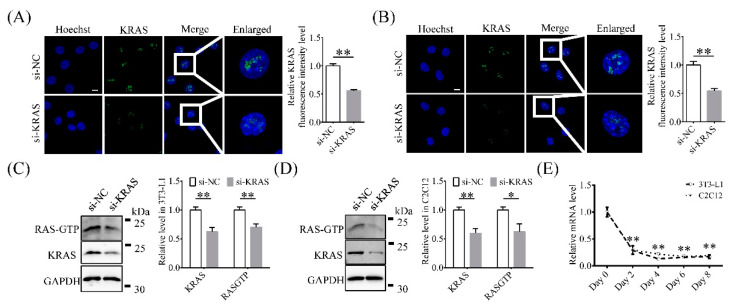
Intracellular localization of Kirsten rat sarcoma 2 viral oncogene homolog (KRAS) and knockdown efficiency determination. (A,B) Representative immunofluorescence images and relative fluorescence intensity levels of KRAS in 3T3-L1 and C2C12 cells with or without KRAS inhibition. Scale bar = 10 μm. Significant differences are represented with ** (p < 0.01). (C,D) Protein levels of KRAS and RAS-guanosine triphosphate (GTP) in 3T3-L1 and C2C12 cells with or without siRNA treatment. Significant differences are represented with * (p < 0.05) and ** (p < 0.01). (E) Relative Kras mRNA expression level changes during adipogenic differentiation in 3T3-L1 and C2C12 cells. Significant differences are represented with ** (p < 0.01).
Western blotting analysis
Western blotting analyses were performed as previously described using 30μg lysates from fresh tissues and cells [6]. Proteins were visualized by exposing Chemiluminescent HRP Substrate (Millipore, Billerica, MA, USA) by protein imprinting imaging system (Tanon5200, China). Antibodies against human GDF15, AKT1, Erk1/2, GAPDH were purchased from Santa Cruz Biotechnology (Dallas, TX, USA). Anti-PI3K (p-p110a) was from Abcam Technology (Cambridge, MA, USA). Anti-p-AKT was purchased from CST (Littleton, CO, USA). Anti-Ras and Anti-Ras-GTP was from NewEast Biosciences (WuHan, CN). Anti-p-Erk1/2, anti-ErbB2, anti-p-ErbB2, anti-FOXO1 were from Abclonal Technology (Boston, MA, USA).
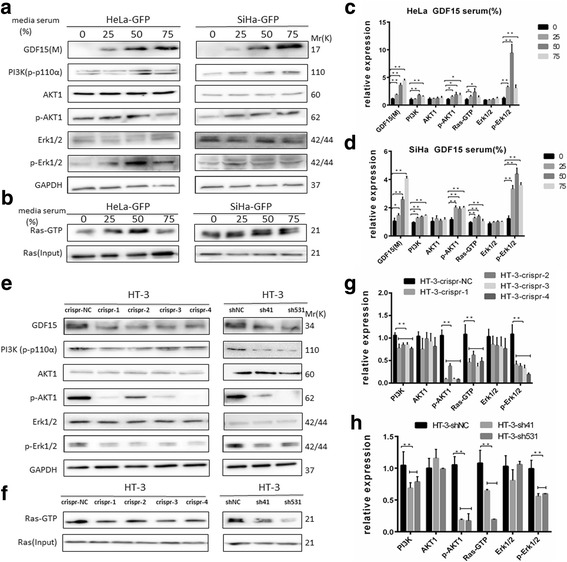
GDF15 induced activation of AKT1 and ERK1/2 in human cervical cancer cell lines. GDF15, PI3K, AKT/p-AKT1, and Erk1/2/p-Erk1/2 were determined by western blotting and Ras-GTP was by immunoprecipitation. Western blotting of cell lysates from HeLa-GFP and SiHa-GFP cells which were incubated with 0%, 25%, 50% and 75% conditioned medium for 24 h (a and b) and the quantitative analysis are shown (c and d). Western blotting of cell lysates from HT-3-crispr-GDF-15 and HT-3-shGDF15 and their control cell lines (e and f) and the quantitative analysis are shown (g and h). N: nuclear protein; M: medium protein. The data were shown as the mean ± SD of three independent experiments. *p < 0.05, **p < 0.01 vs. control using One-Way ANOVA
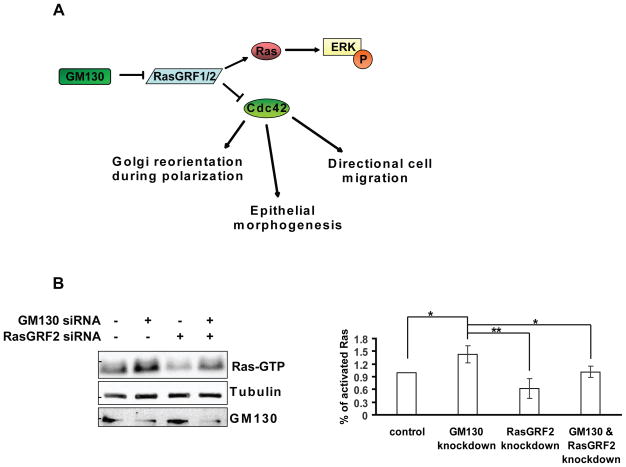
(A) Working model: GM130 acts as a suppressor of RasGRF activity, thereby modulating the activities of Ras and Cdc42. According to this model, the knockdown of GM130 results in increased Ras activation and decreased Cdc42 activation. (B) HepG2 cells were transfected with the indicated siRNAs. After 72 h, cells were lysed and Ras pull-down was performed using GST-RBD. The eluate form the beads was subjected to SDS-PAGE followed by immunoblotting with a pan-Ras antibody (Ras-GTP). 5% of the original lysate was subjected to SDS-PAGE followed by immunoblotting against tubulin and GM130. Bar graph represents a quantification of the amount active Ras (Ras-GTP) normalized to tubulin. Results are means ± SD from three independent experiments. Asterisks indicate statistically significant differences tested using ANOVA with Newman-Keuls multiple comparison test (*p<0.05; ** p<0.01).
R-Ras, H-Ras, Cdc42, RhoA, and Rac1/Rac2 Activity Assays
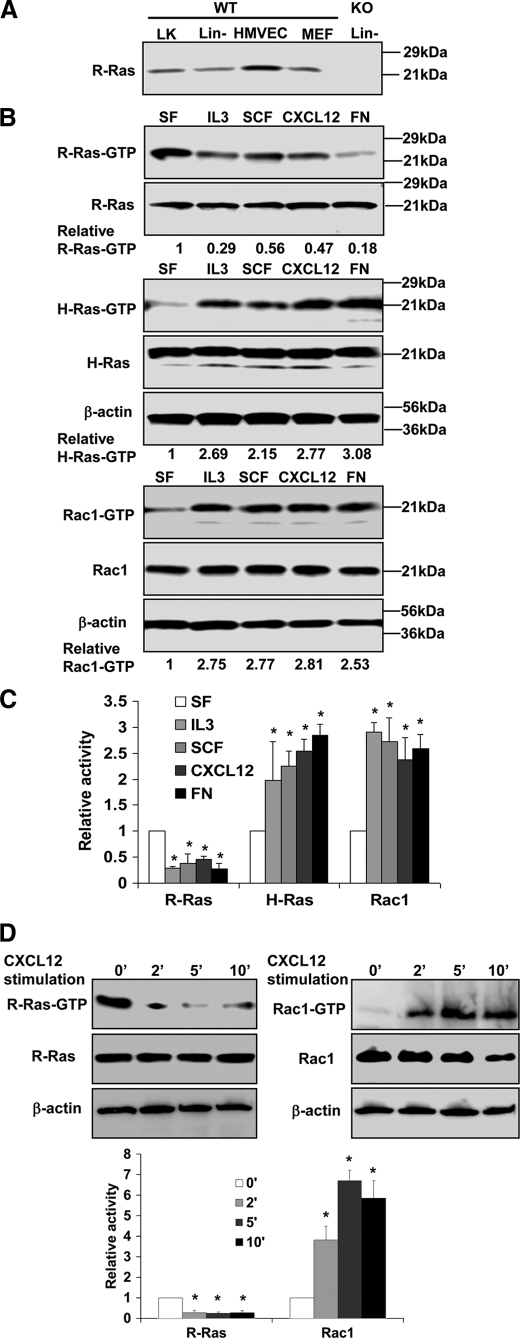
The relative levels of Rac1-GTP, Rac2-GTP Cdc42-GTP, R-Ras-GTP, and H-Ras-GTP in Lin− cells were examined by effector domains of GST-PAK1 or GST-cRaf1 pulldown protocols (33). Briefly, the isolated wild-type or mutant Lin− cells were starved in serum/cytokine-free IMDM overnight and challenged with rrSCF (100 ng/ml), CXCL12 (100 ng/ml), or IL-3 (20 ng/ml) for single or multiple time points of 2, 5, and 10 min prior to the effector domain pulldowns. Separately, the cells adhering to fibronectin fragment (CH296)-coated surfaces for 2 h were subjected to a similar GST-cRaf1 pulldown assay compared with the cells in suspension. The levels of active Rac1, Cdc42, Rac2, R-Ras, and H-Ras were detected by monoclonal anti-Rac1, anti-Cdc42 (both from BD Transduction), polyclonal anti-Rac2 (Novus Biologicals, Littleton, CO), polyclonal anti-R-Ras (Cell Signaling Technology, Boston, MA), and monoclonal anti-H-Ras (Santa Cruz Biotechnology, Santa Cruz, CA) antibodies, respectively.
Analysis of R-Ras, H-Ras, and Rac1 activities in HPCs.
A, expression of R-Ras in HPCs. Lin− and Lin−/c-Kit+ (LK) cells were harvested from WT or knock-out (KO) mouse BM. Expression of R-Ras of the indicated samples was examined by Western blotting. B, R-Ras, H-Ras, and Rac1 activities under various stimulatory conditions in Lin− cells. Lin− cells from WT mice under various stimulatory conditions were subjected to effector domain pulldown assays, and the activities of R-Ras, H-Ras, and Rac1 were examined. Blotting of the respective total cell lysates was carried out in parallel. Relative amounts of GTP-bound form of the GTPases were quantified by densitometry and normalized to the nonstimulated control. Data are representative of three independent experiments. C, relative activities quantified by densitometry and normalized to the nonstimulated control (mean ± S.D. from three independent experiments). D, R-Ras and Rac1 activities under CXCL12 stimulation at multiple time points (mean ± S.D. (error bars) from three independent experiments). *, p < 0.05.
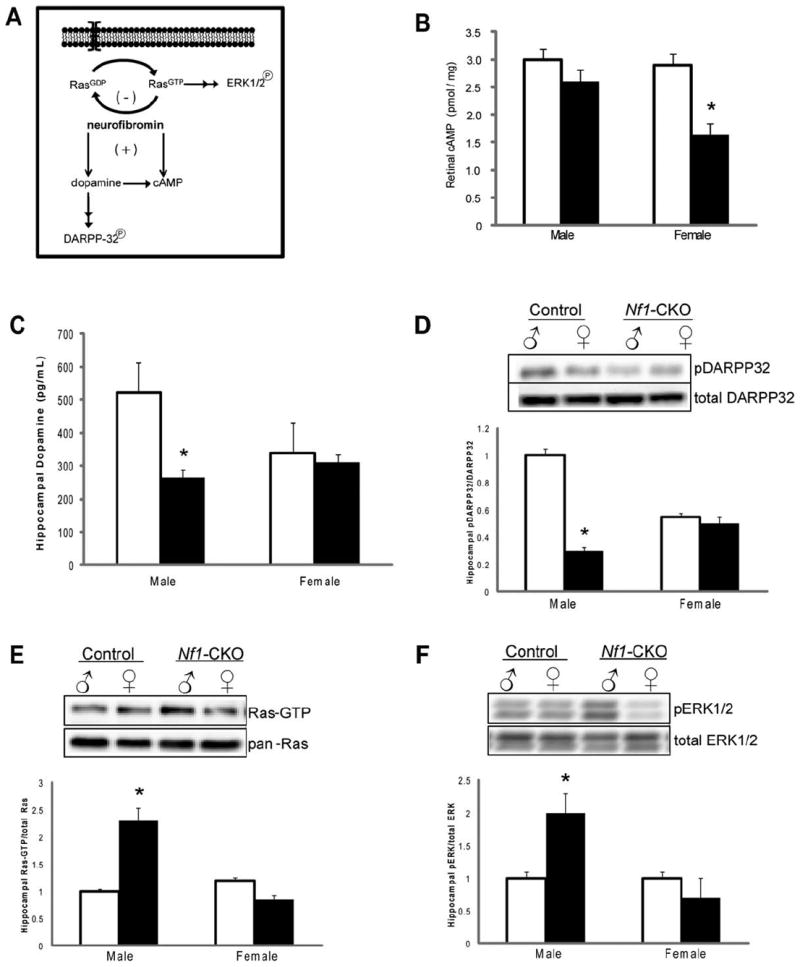
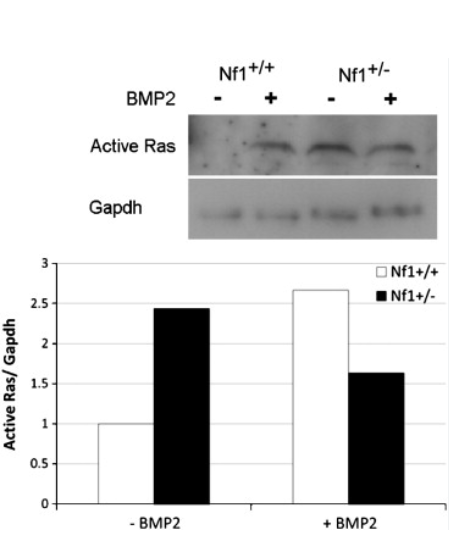
(A) Established molecular pathways regulated by the NF1 gene product, neurofibromin. (B) Retinal cyclic adenosine monophosphate (cAMP) levels were reduced by 47% in female Nf1-CKO mice relative to female controls. No change in retinal cAMP levels was observed in male Nf1-CKO mice relative to male controls. (C) Hippocampal dopamine levels were reduced 2-fold in male Nf1-CKO mice compared to male controls. No differences were observed in female Nf1-CKO mice relative to female controls. (D) DARPP32 phosphorylation was reduced in the hippocampus of Nf1-CKO male, but not female, mice. (E, F) Densitometric quantification reveals increased active (guanosine triphosphate [GTP]-bound) Ras (Ras-GTP levels relative to total Ras; E) and ERK (phospho-ERK1/2 relative to total ERK1/2; F) activation in male, but not female, Nf1-CKO hippocampi relative to controls. *p <0.05.
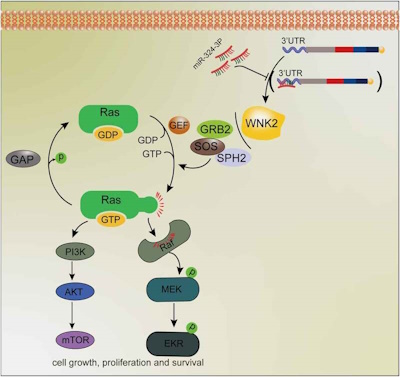
2.14. RAS activity detection
To verify the phosphorylation modification sequencing results, we purchased the RAS activity detection kit from Wuhan New East Biosciences Co., Ltd. (Wuhan, China). We cultured OC cells (sh-NC SKOV3, sh-WNK2 SKOV3, sh-NC CAOV3, and sh-WNK2 CAOV3) in 10 cm dishes. Then, we extracted 1.5 mg of proteins from each sample and incubated them with active RAS antibody and protein A/G beads for 2 h. After washing the beads three times, 20 µL of 2x loading buffer was added and the protein was heated at 100°C for 10 min. Subsequently, western blotting was performed as previously described.
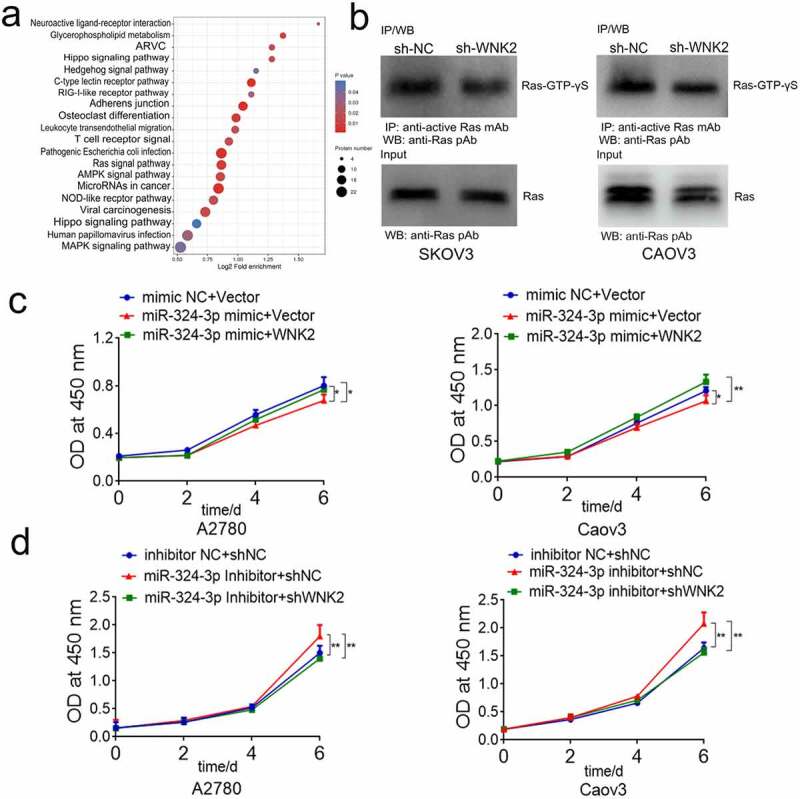
miR-324-3p inhibits OC development by targeting WNK2/RAS pathway. (a) KEGG enrichment analysis of phosphorylation modification proteome profiling. (b) WNK2 knockdown reduced the level of RAS-GTP. (c) WNK2 partly reversed the viability suppression of miR-324-3p on OC cells. (d) WNK2 knockdown partly reversed the tumor promoting roles of miR-324-3p inhibitors on OC cells. ** P < 0.01, *** P < 0.001.
Ras activation assay
The Ras-PI3K-Rac pathway downstream of G proteins is a key signaling pathway forvesicle formation.
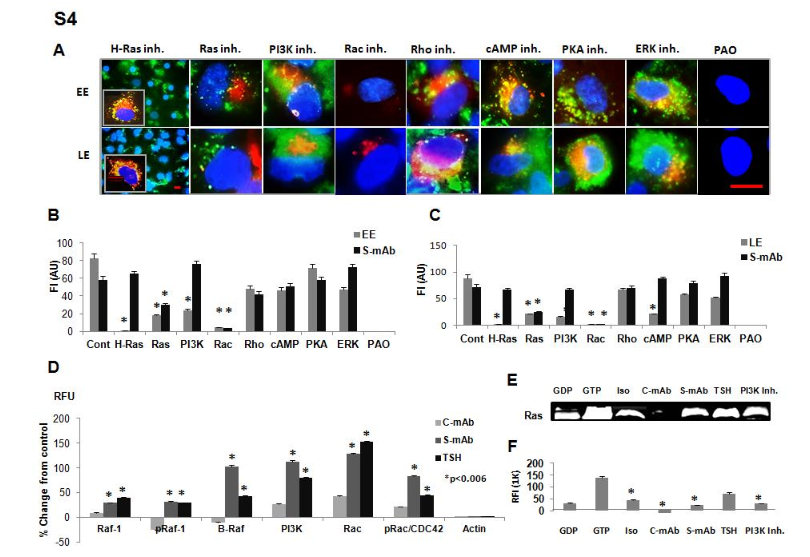
(A) Live-cell imaging of early endosomes (EE) and late endosomes (LE) in thyrocytespretreated with different inhibitors (all at 10 M) in the presence of labelled (green) S-TSHR-mAb (1g/ml); inset shows antibody-treated cells without inhibitors. Malformed endosomes (red) were alsopresent in the different treatments. Scale bar, 100 µm. (B and C) Representative images were analyzedquantitatively by measuring the fluorescence intensity (FI) of EE (red), LE (red), and labeled TSH(green). Data are means ± SEM of three independent experiments. *P < 0.006 compared to control-mAbafter exposure to the same series of inhibitors as those shown in (A). (D) Percentage change in protein asRFU compared to control-mAb (hamster IgG2, k chain) was determined by proteomic array analyses ofRaf-1, pRaf-1, B-Raf, PI3K, Rac, and pRac/CDC42 in cells treated as indicated. Data are means ± SEMof three independent experiments. *P < 0.006 compared to C-mAb. (E) Immunoprecipitated active RasGTP was detected by LI-COR Western blotting. Thyrocytes were treated with GDP (100 µM), GTP (10mM), the indicated antibodies (all at 1 µg/ml), TSH (1 mU/ml), or PI3K inhibitor (10 µM) for 24 hoursand then immunoprecipitated with mAb against Ras-GTP. (F) Relative fluorescence intensity (RFI) of theWestern blotting bands was quantified with Image Studio software.
Ras activity assay
The relative activity of Ras GTPase was examined using a commercial Ras activation assay Kit (NewEast Biosciences, USA). Briefly, equal amounts of cell lysates (1.0 mg total protein) were sequentially incubated with anti-active RAS monoclonal antibody at 4 °C and protein A/G Agarose beads each for 30 min, then centrifuged at 5000×g for 1 min, washed with 0.5 ml 1 × Assay/Lysis buffer. Then the beads were boiled in protein loading buffer, and the released proteins were separated by 12% SDS-PAGE gels and transferred onto an Immobilon-P membrane (Millipore Corporation, Bedford, MA). RAS expression was queried using the anti-RAS antibody provided by the kit.
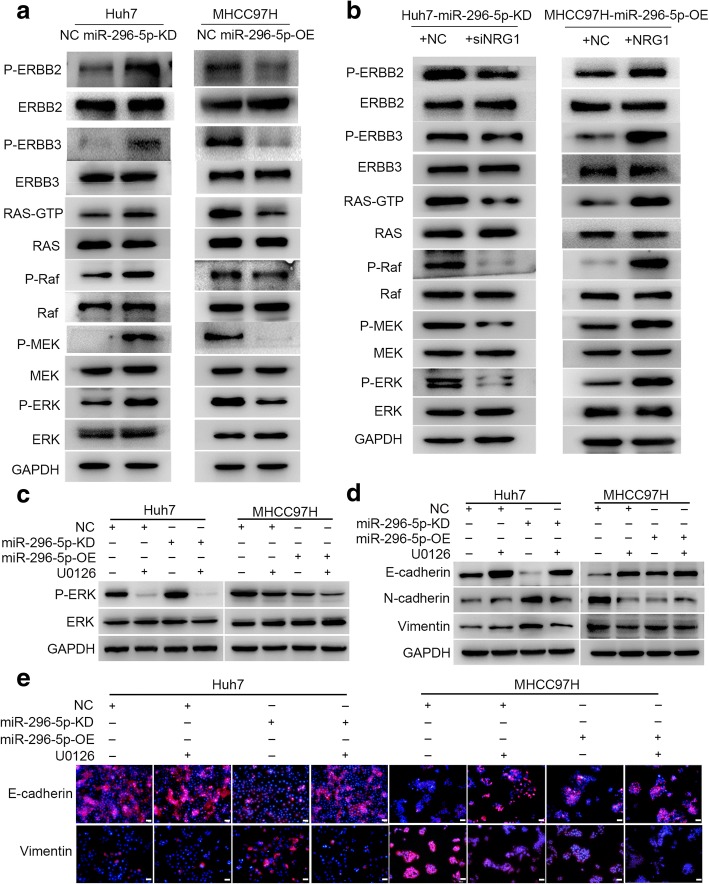
miR-296-5p mediates HCC EMT by ERBB2/ERBB3/RAS/MAPK signaling.
(a) The levels of ERBB2, ERBB3 and RAS/MAPK signaling-related proteins in miR-296-5p-KD Huh7, miR-296-5p-OE MHCC97H cells and their corresponding control cells. (b) The protein levels of ERBB2, ERBB3 and RAS/MAPK signaling-related molecules in siNRG1-transfected miR-296-5p-KD Huh7 cells, NRG1-expressing plasmids transfected miR-296-5p-OE MHCC97H cells and their counterparts. The protein expressions of P-ERK (c) and EMT markers (d and e) in miR-296-5p-KD Huh7, miR-296-5p-OE MHCC97H cells and their corresponding control cells after U0126 treatment
Ras activation assay
A Ras activation kit (Cell Signalling) was used to assay for active Ras. Briefly, macrophages were seeded at 1 × 10⁸ cells ml− 1 and phagocytosis was activated as described before. Macrophages were then lysed with lysis buffer (Cell Signalling) according to the vendor’s instructions. One millilitre of lysate was incubated with Raf1-RBD agarose bead slurry (Cell Signalling) for 1 h at 4 °C, and then the beads were pelleted and washed before carrying out immunoblotting using rabbit polyclonal anti-Ras antibody (Cell Signalling). The positive control for this experiment was GTPγS-treated macrophage lysates and the negative control was GDP-treated macrophage lysates prepared as per the vendor’s instructions.
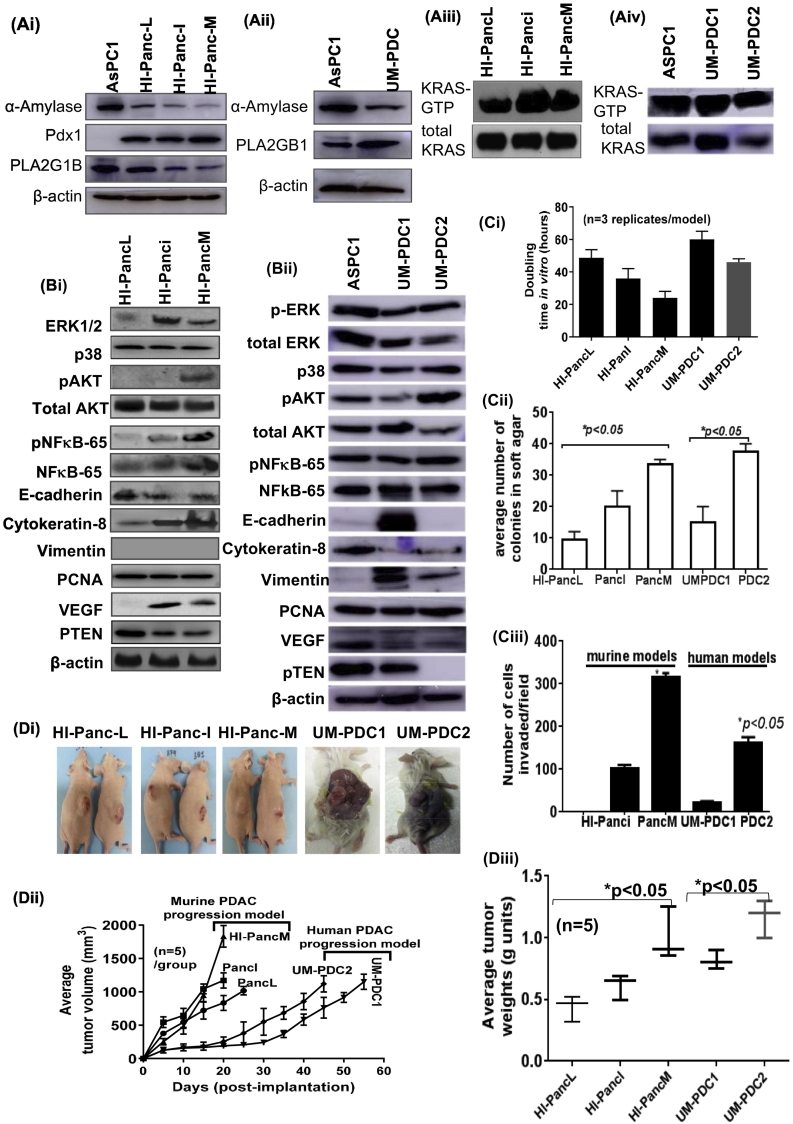
Characterization of HI-PancL, HI-PancI, HI-PancM and UM-PDC models.
(A) Immunoblot images showing the expression of (Ai-Aii) pancreatic markers (α-Amylase, Pdx1, and PLA2G1B) and (Aiii-Aiv) K-ras activity status in murine (HI-Panc-L, HI-Panc-I, & HI-Panc-M) and human PDAC models (UM-PDC). A known PDAC cell line AsPC1 was used as a reference control. (B) Immunoblot images showing the expression of (Bi-Bii) downstream targets of K-ras pathway (ERK1/2, p38, pAkt, total Akt, pNFκB-p65, total NFκB-p65, VEGF), epithelial markers (E-Cadherin, Cytokeratin-8), and proliferation marker (PCNA) in murine and human PDAC models. (C) Histograms showing the (Ci) cell doubling time (in hour units) n=3 replicates/model; (Cii) 3-dimensional clonogenic potential of HI-Panc-L, HI-Panc-I, HI-Panc-M, and UM-PDC models; (Ciii) invasiveness potential; and (D) the tumorigenic potential of cell models as xenografts in mouse models (Di) photographs showing intact tumors on athymic nude (for murine models) and SCID (for human model) mice. (Dii) Line graph showing the growth of tumors in mice as a function of time to average tumor volume (n=5). (Diii) Graph showing the average weight of tumors formed by cell models when implanted in immunocompromised mice (n=5).
2.5. Evaluation of RAS Activation
A New East Assay Kit (NewEast Biosciences, Wuhan, China) was used for Ras detection according to the manufacturer’s instructions. Briefly, approximately 80–90% confluent cultured cells (10-cm plate) were stimulated with GA (0.2, 20 or 20 µM) for 6 h. Then, the culture media was aspirated, and 500 µL of the assay/lysis buffer was added to the cells, and it was incubated on ice for 10–20 min. The lysates were clarified by centrifugation for 10 min (12,000·g, at 4 °C). The GTPγS- and GDP-bound proteins served as positive and negative controls, respectively. The cell extracts were divided into two tubes, and 20 µL of 0.5 M EDTA was added. Five microliters of GTPγS was added to the positive control, and 5 µL of GDP was added to the negative control. The tubes were incubated at 30 °C for 30 min, and the loading was terminated by placing the tubes on ice and then adding 60 mM MgCl2. Then, an antiactive Ras monoclonal antibody (1 µL) was added to each tube. A resuspended bead slurry was quickly added to each tube. Then, the tubes were incubated at 4 °C for 1 h with gentle agitation. The beads were pelleted by centrifugation for 1 min at 5000·g. The supernatant was aspirated and discarded, and the beads were washed 3 times with the assay/lysis buffer. The tubes were boiled for 5 min prior to the SDS-PAGE and western blot analyses.
KRAS Activation Assay
The level of active KRAS was assessed using a RAS activation assay kit (NewEast Biosciences, Malvern, PA, #81101), according to the manufacturer’s protocol. Cells were cultured in 10 cm plates to 80%–90% confluence before different treatments. Total cell lysates were collected and incubated with anti-active RAS monoclonal antibody plus protein A/G agarose bead slurry at 4°C for 1 h with gentle agitation. Agarose beads were resuspended in 20 μL of 2× reducing SDS-PAGE sample buffer and boiled. Precipitated active RAS was detected by immunoblot analysis using anti-KRAS monoclonal antibody, according to the manufacturer’s instructions.
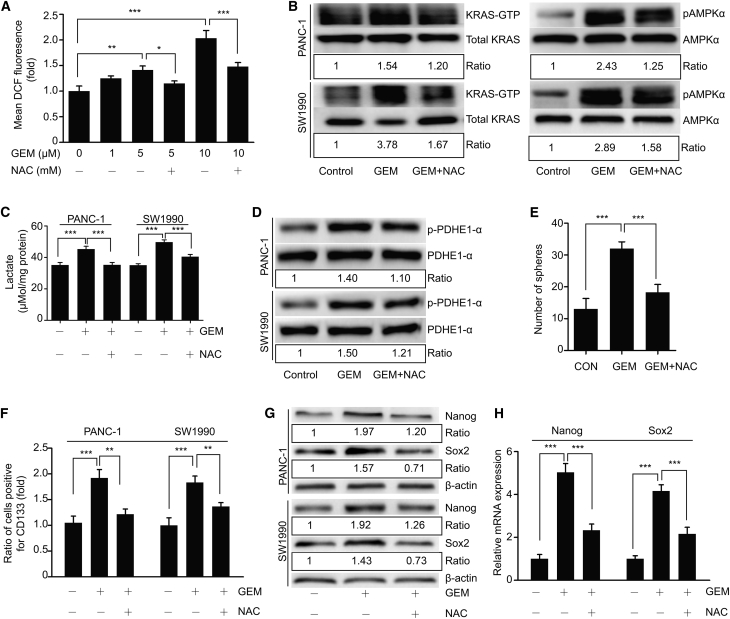
GEM-Induced ROS Is Involved in Activation of the KRAS/AMPK Pathway
(A) ROS levels were measured using flow cytometry with a DCFH-DA probe in PANC-1 cells pretreated with 5 mM NAC (a ROS scavenger) for 1 h followed by treatment with different doses of GEM for 24 h. (B) Role of ROS in activation of the KRAS/AMPK pathway. PANC-1 and SW1990 cells were pretreated with NAC (5 mM, 1 h) followed by treatment with GEM (5 μM) for 24 h. Activation of KRAS and AMPK were evaluated by western blot. (C) Lactate production by PANC-1 and SW1990 cells pretreated with NAC (5 mM, 1 h) followed by treatment with GEM (5 μM) for 36 h. (D) Levels of p-PDHE1-α in cells treated as in (B) were examined by western blot. Ratios represent the intensity of the p-PDHE1-α band normalized against total PDHE1-α, then normalized against the control. (E–H) Effect of GEM-induced ROS on cancer stemness. (E) PANC-1 cells were treated as in (B). Treated cells were cultured as described. (F and G) CD133 and the pluripotency markers Nanog and Sox2 were examined using flow cytometry (F) or western blot (G) in cells treated as in (B). Ratios were obtained as previously described. (H) qRT-PCR analysis was used to examine mRNA levels of Nanog and Sox2 in PANC-1 cells treated as in (B). β-actin served as an internal control. Ratios represent the intensity of the KRAS-GTP or p-AMPKα bands, normalized against total KRAS or AMPKα, then normalized against controls. GEM, gemcitabine. All experiments were repeated at least three times
Ras activity assay
The relative activity of Ras GTPase was examined using a commercial Ras activation assay Kit (NewEast Biosciences, USA). Briefly, equal amounts of cell lysates (1.0 mg total protein) were sequentially incubated with anti-active RAS monoclonal antibody at 4 °C and protein A/G Agarose beads each for 30 min, then centrifuged at 5000×g for 1 min, washed with 0.5 ml 1 × Assay/Lysis buffer. Then the beads were boiled in protein loading buffer, and the released proteins were separated by 12% SDS-PAGE gels and transferred onto an Immobilon-P membrane (Millipore Corporation, Bedford, MA). RAS expression was queried using the anti-RAS antibody provided by the kit.
miR-296-5p mediates HCC EMT by ERBB2/ERBB3/RAS/MAPK signaling. (a) The levels of ERBB2, ERBB3 and RAS/MAPK signaling-related proteins in miR-296-5p-KD Huh7, miR-296-5p-OE MHCC97H cells and their corresponding control cells. (b) The protein levels of ERBB2, ERBB3 and RAS/MAPK signaling-related molecules in siNRG1-transfected miR-296-5p-KD Huh7 cells, NRG1-expressing plasmids transfected miR-296-5p-OE MHCC97H cells and their counterparts. The protein expressions of P-ERK (c) and EMT markers (d and e) in miR-296-5p-KD Huh7, miR-296-5p-OE MHCC97H cells and their corresponding control cells after U0126 treatment
Immunoblotting
Cells and tumour samples were incubated in lysis buffer [50 mM HEPES pH 7.4, 150 mM NaCl, 1% Triton X-100, 1 mM EDTA supplemented with protease inhibitors (Calbiochem, Darmstadt, Germany)], homogenized in Laemmli sample buffer and boiled for 10 min. Proteins were resolved by SDS-polyacrylamide gel electrophoresis (SDS-PAGE) and then transferred to polyvinylidene (PVDF) membranes (Millipore, Schwalbach, Germany), which were then incubated with the respective antibodies. The rabbit anti-MKL1 antibody was generated by injecting rabbit with glutathione S-transferase (GST)-MKL1 (amino acids 601–931) purified from Escherichia coli. Antiserum to MKL2 was generated by injecting rabbits with GST-MKL2 (amino acids 703–1049) purified from E. coli as described by Cen et al (Cen et al, 2003).
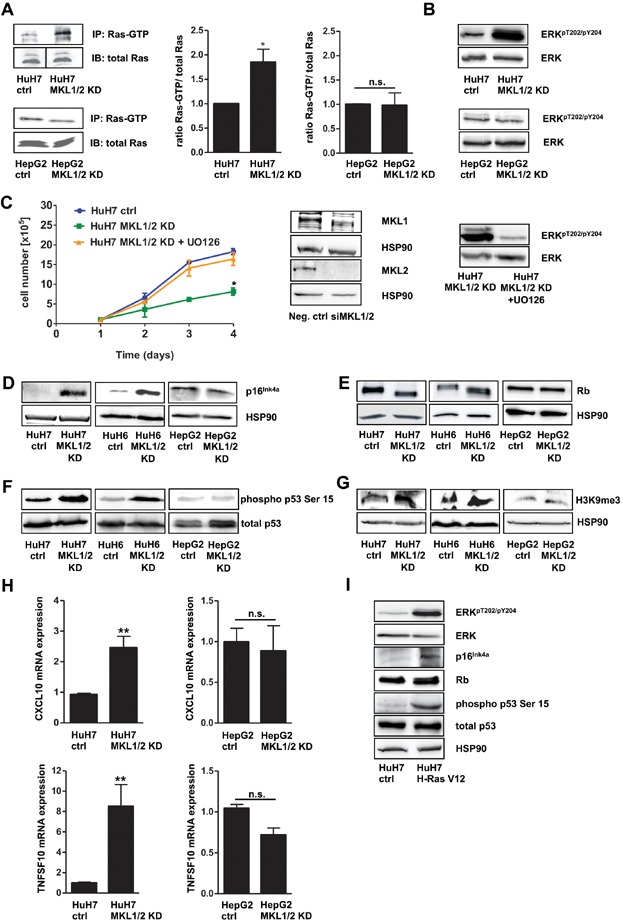
Loss of MKL1/2 leads to oncogene-induced senescence
- HuH7, HuH7 MKL1/2 KD, HepG2 and HepG2 MKL1/2 KD cells were immunoprecipitated with anti-active Ras antibody and immunoblotted with anti-Ras antibody. Equal amounts of lysates were directly immunoblotted with anti-Ras antibody. The black line delineates a boundary caused by juxtaposing lanes that were non-adjacent in the same gel. The relative ratio of active Ras versus total Ras was quantitated and graphically depicted on the right. Values are mean ± SD; *p = 0.046.