
Published Pictures for 26912 Rap1-GTP mAb
Rap1 Activity Assays
8CPT 2′OMe-cAMP (Biolog, Hayward, CA) is a compound commonly used as a means to induce Rap1 activation in cells.32 To confirm activation of Rap1 in RPE after this treatment, we performed standard Rap1 activity assays as described in detail previously.33 In brief, lysates were incubated with a GST-fusion protein of the Ras/Rap binding domain of the effector protein RalGDS (GST-RalGDS-RBD), immobilized on glutathione sepharose beads. This fusion protein specifically recognizes and binds only to active GTP-bound Rap1.34 The amount of active Rap1(from the pulldown) and total Rap1 (from a sample of reserved total cell lysate) was determined by Western blot analysis with a polyclonal anti-Rap1 antibody (Santa Cruz Biotechnology) which recognizes both isoforms of Rap1, followed by an HRP-conjugated anti-rabbit secondary antibody (Chemicon, Billerica, MA).
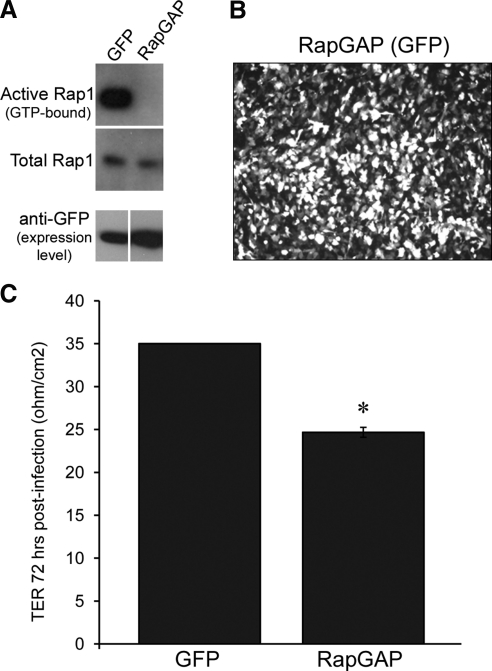
Loss of Rap1 GTPase activity by expressing RapGAP reduces plateau TER in ARPE-19 cells.
(A) Comparison of active (GTP-bound) Rap1 in lysates of ARPE-19 cells expressing either GFP control or RapGAP and assayed. Active (GTP-bound) pool of Rap1 is shown in top row; middle row confirms equivalent loading using total Rap1 from whole cell lysates and bottom row indicates equal amount of expressed protein. (B) Immunofluorescence microscopy of a Transwell-grown monolayer of ARPE-19 72 hours postinfection to confirm that adenoviral infection efficiency of RapGAP approaches 100% (visualized by a cocistronically expressed GFP marker). (C) ARPE-19 cells grown on Transwell filters were infected with adenovirus to express either RapGAP or GFP only as a control. TER measurements were taken 72 hours post virus addition. Shown are data from one of three independent experiments. TER is significantly reduced when RapGAP has been expressed for 72 hours (*P = 0.0000032, n = average of 3 filters per condition).
Rap1 Activity Assays
8CPT 2′OMe-cAMP (Biolog, Hayward, CA) is a compound commonly used as a means to induce Rap1 activation in cells.32 To confirm activation of Rap1 in RPE after this treatment, we performed standard Rap1 activity assays as described in detail previously.33 In brief, lysates were incubated with a GST-fusion protein of the Ras/Rap binding domain of the effector protein RalGDS (GST-RalGDS-RBD), immobilized on glutathione sepharose beads. This fusion protein specifically recognizes and binds only to active GTP-bound Rap1.34 The amount of active Rap1(from the pulldown) and total Rap1 (from a sample of reserved total cell lysate) was determined by Western blot analysis with a polyclonal anti-Rap1 antibody (Santa Cruz Biotechnology) which recognizes both isoforms of Rap1, followed by an HRP-conjugated anti-rabbit secondary antibody (Chemicon, Billerica, MA).
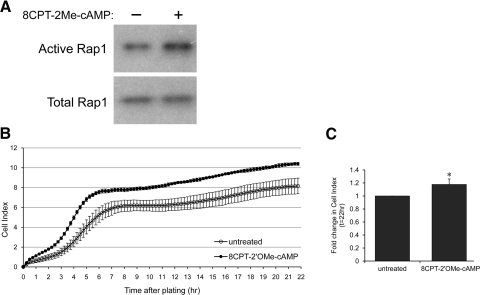
Rap1 can be activated with the drug 8CPT-2′OMe-cAMP in ARPE-19, and this increases electrical impedance.
(A) Confluent ARPE-19 cells were treated with vehicle (PBS) or with the Rap1-activating drug 8CPT-2′OMe-cAMP before harvesting lysates for determination of Rap1 activity. Active (GTP-bound) Rap1 is shown in top row, and bottom row confirms equivalent loading using total Rap1 from whole cell lysates. (B) ARPE-19 cells were treated with vehicle (PBS) or drug, and electrical impedance was measured using RTCA. Graph shows a typical RTCA trace from one representative experiment. (C) Combined data from 3 independent experiments showing the fold change in Cell Index ± SD, 22 hours after 8CPT-2′OMe-cAMP treatment, normalized to untreated control. Rap1 activation increases Cell Index, indicating enhanced barrier properties (*P = 0.01, n = 3 independent experiments).
Immunoprecipitation and Western Blots
Following treatment, CECs were washed once with ice cold PBS. Then ice cold radioimmunoprecipitation assay (RIPA) lysis buffer containing both protease inhibitors (Millipore Sigma, Burlington, MA) and phosphatase inhibitors (ThermoFisher Scientific, Rockford, IL) was added to each well. CECs were scraped from the surface of the well plate and transferred to 1.5 mL microcentrifuge Eppendorf tubes. Lysates were clarified by spinning for 10 minutes at 16,000 × g, at 4°C. Supernatants were transferred to new Eppendorf tubes, and a bicinchoninic acid (BCA) assay was performed to determine protein concentrations. Protein from cell lysates was suspended in 1X sample buffer and denatured at 95°C for 5 minutes to assess protein expression by western blot. Co-immunoprecipitation (co-IP) or immunoprecipitation (IP) was performed by incubating 400 μg of protein from the same cell lysate with 10 μL Dynabeads protein G (Invitrogen, Carlsbad, CA) and antibodies to either rabbit anti-GFP (1:200, Abcam, Cambridge, MA), mouse anti-Myc (1:50, Santa Cruz Biotechnology, Dallas, Texas), mouse anti-Rac1GTP (1:200, NewEast Bioscience, King of Prussia, PA), or mouse anti-Rap1GTP (1:200, NewEast Bioscience, King of Prussia, PA) overnight with gentle rocking at 4°C. The Dynabead/antibody/protein complex was washed three times with RIPA lysis buffer, re-suspended in 2X sample buffer and denatured at 95°C for 5 minutes. The protein complex bound to GFP, Myc, Rac1GTP, or Rap1GTP was separated by western blot.
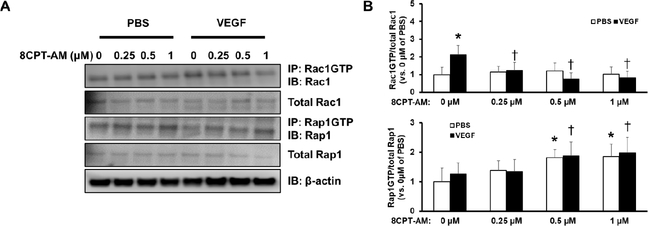
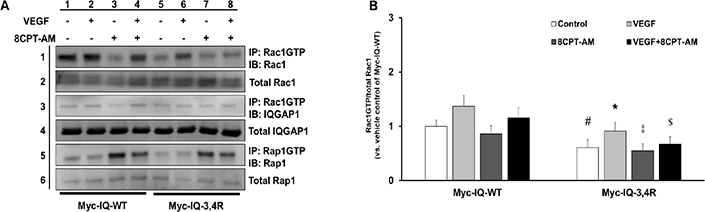
Rap1 activation reduces VEGF-induced Rac1 activation in a dose-dependent manner.
A) Representative western blot images depicting Rac1 activation by immunoprecipitation of Rac1GTP and blot of total Rac1 (row 1), total Rac1 (row 2), Rap1 activation by immunoprecipitation of Rap1GTP and blot of total Rap1 (row 3), total Rap1 (row 4), and β-actin (row 5) in lysates from CECs treated with 0.05% DMSO (0 μM 8CPT-AM), 0.25 μM, 0.5 μM, or 1 μM of 8CPT-AM in the presence of PBS or VEGF (50 ng/mL). B) Quantification of Rac1 activation (top) and Rap1 activation (bottom) by densitometry analysis (Normalized mean±SEM, *p<0.05 vs. 0 μM of PBS, †p<0.05 vs. 0 μM of VEGF, n=3 per group from 3 independent experiments)
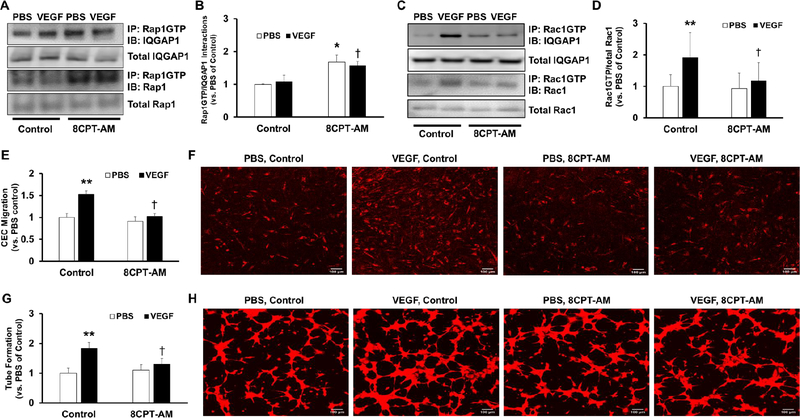
Rap1 activation reduces VEGF-induced Rac1 activation, migration, and tube formation by interacting with IQGAP1 in CECs.
A) Representative western blot images that show Rap1GTP interactions with IQGAP1 determined by co-immunoprecipitation (row 1), total IQGAP1 (row 2), Rap1 activation by immunoprecipitation (row 3), and total Rap1 (row 4) in lysates from CECs treated with PBS and 0.05% DMSO (Control), VEGF (50 ng/mL) and Control, PBS and 8CPT-AM (1 μM), or VEGF and 8CPT-AM for 30 minutes; B) Quantification of Rap1GTP interactions with IQGAP1 by densitometry analysis (Normalized mean±SEM, *p<0.05 vs. PBS of Control, †p<0.05 vs. VEGF of Control, n=3 per group from 3 independent experiments);
Immunocytochemistry of Choroidal Endothelial Cells
CECs, grown on glass coverslips (Thomas Scientific, Swedesboro, NJ), were transfected for 48 hours with GFP-tagged IQGAP1 plasmid constructs and then treated with either 1μL PBS and 0.05% DMSO, 50 ng/mL VEGF and 0.05% DMSO, 1 μL PBS and 1 μM 8CPT-AM, or 50 ng/mL VEGF and 1 μM 8CPT-AM for 30 minutes. CECs were fixed for 10 minutes with 4% paraformaldehyde (PFA, Electron Microscopy Sciences, Hatfield, PA) at room temperature and washed three times with PBS. CECs were blocked and permeabilized for one hour at room temperature in PBS containing 5% normal goat serum (NGS) and 0.4% TritonX-100. CECs were stained with rabbit anti-GFP (1:100, Abcam, Cambridge, MA) and either mouse anti-IQGAP1 (1:100, BD Biosciences, San Jose, CA) or mouse anti-Rap1GTP (1:100, NewEast Bioscience, King of Prussia, PA) overnight at 4°C. CECs were washed three times with PBS and incubated for one hour with AlexaFluor 488 goat anti-rabbit secondary antibody (1:500, Abcam, Cambridge, MA) for GFP, AlexaFluor 647-conjugated rat anti-mouse secondary antibody (1:500, BioLegend, San Diego, CA, USA) for IQGAP1 or Cy3-conjugated goat anti-mouse secondary antibody (1:500, Jackson ImmunoResearch Inc., West Grove, PA) for Rap1GTP for one hour at room temperature. After three washes in PBS, the coverslips were mounted in DAPI Fluoromount-G (SouthernBiotech, Birmingham, AL). Images were captured using a confocal microscope (Olympus Corporation, Japan) at 100X objective.
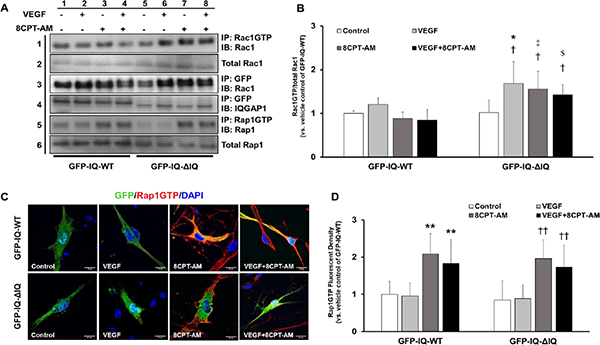
Active Rap1 binding the IQ domain of IQGAP1 is necessary to reduce VEGF-induced Rac1 activation in CECs.
A) Representative western blot images that depict Rac1 activation by immunoprecipitation of Rac1GTP and blot of total Rac1 (row 1), total Rac1 (row 2), GFP-tagged IQGAP1 plasmid construct (i.e., either GFP-IQ-WT or GFP-IQ-ΔIQ) interactions with Rac1 by co-immunoprecipitation (row 3), GFP-tagged IQGAP1 pulled down by immunoprecipitation as loading control (row 4), Rap1 activation by immunoprecipitation (row 5), and total Rap1 (row 6) in lysates from CECs transfected with GFP-IQ-WT (columns 1–4) or GFP-IQ-ΔIQ (columns 5–8) and treated with 0.05% DMSO or 8CPT-AM (1 μM) in the presence VEGF (50 ng/mL) or PBS; B) Quantification of Rac1 activation by densitometry analysis (Normalized mean±SEM, †p<0.05 vs. Control of GFP-IQ-ΔIQ, *p<0.05 vs. VEGF of GFP-IQ-WT, ‡p<0.05 vs. 8CPT-AM of GFP-IQ-WT, $p<0.05 vs. VEGF+8CPT-AM of GFP-IQ-WT, n=3 per group from 3 independent experiments); C) Representative confocal images of CECs labelled to identify GFP tagged IQGAP1 (green), Rap1GTP (red), and DAPI (blue) in response to 1 μL PBS and 0.05% DMSO (control), 50 ng/mL VEGF and 0.05% DMSO (VEGF), 1 μL PBS and 1 μM 8CPT-AM (8CPT-AM), or 50 ng/mL VEGF and 1 μM 8CPT-AM (VEGF+8CPT-AM); D) Quantification of Rap1GTP fluorescent density in response to treatments described in Fig. 3C (Normalized mean±SEM, **p<0.05 vs. Control of GFP-IQ-WT, ††p<0.05 vs. Control of GFP-IQ-ΔIQ, n=3 per group from 3 independent experiments)
2.10 Small GTPase activity assay
Activation of RhoA, Rac1 and Cdc42 was measured using a RhoA/Rac/Cdc42 Activation Assay Combo Biochem Kit (Cytoskeleton), according to the manufacturer’s manual. In brief, Rhotekin-RBD or PAK-PBD affinity beads were added to the cell lysates, and GTPase activity was analyzed by pull-down assay with specific antibodies on a Western blot.
Rap1 activity was tested by measuring active Rap1-GTP level with a Rap1 Activation Assay Kit (NewEast Biosciences). Rap1-GTP in cell lysates was incubated with anti-active Rap1 antibody, and then the bound active Rap1 was pulled down by protein A/G agarose, followed by immunoblot detection.
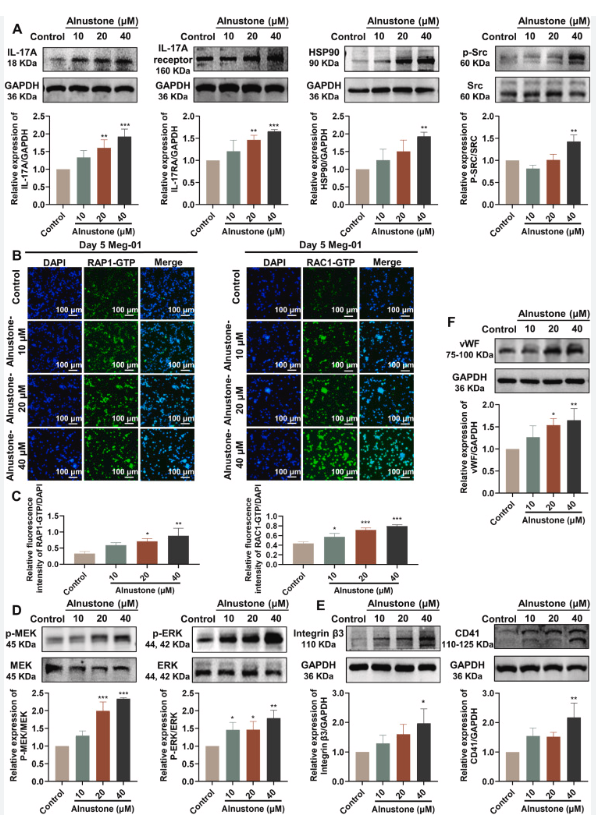
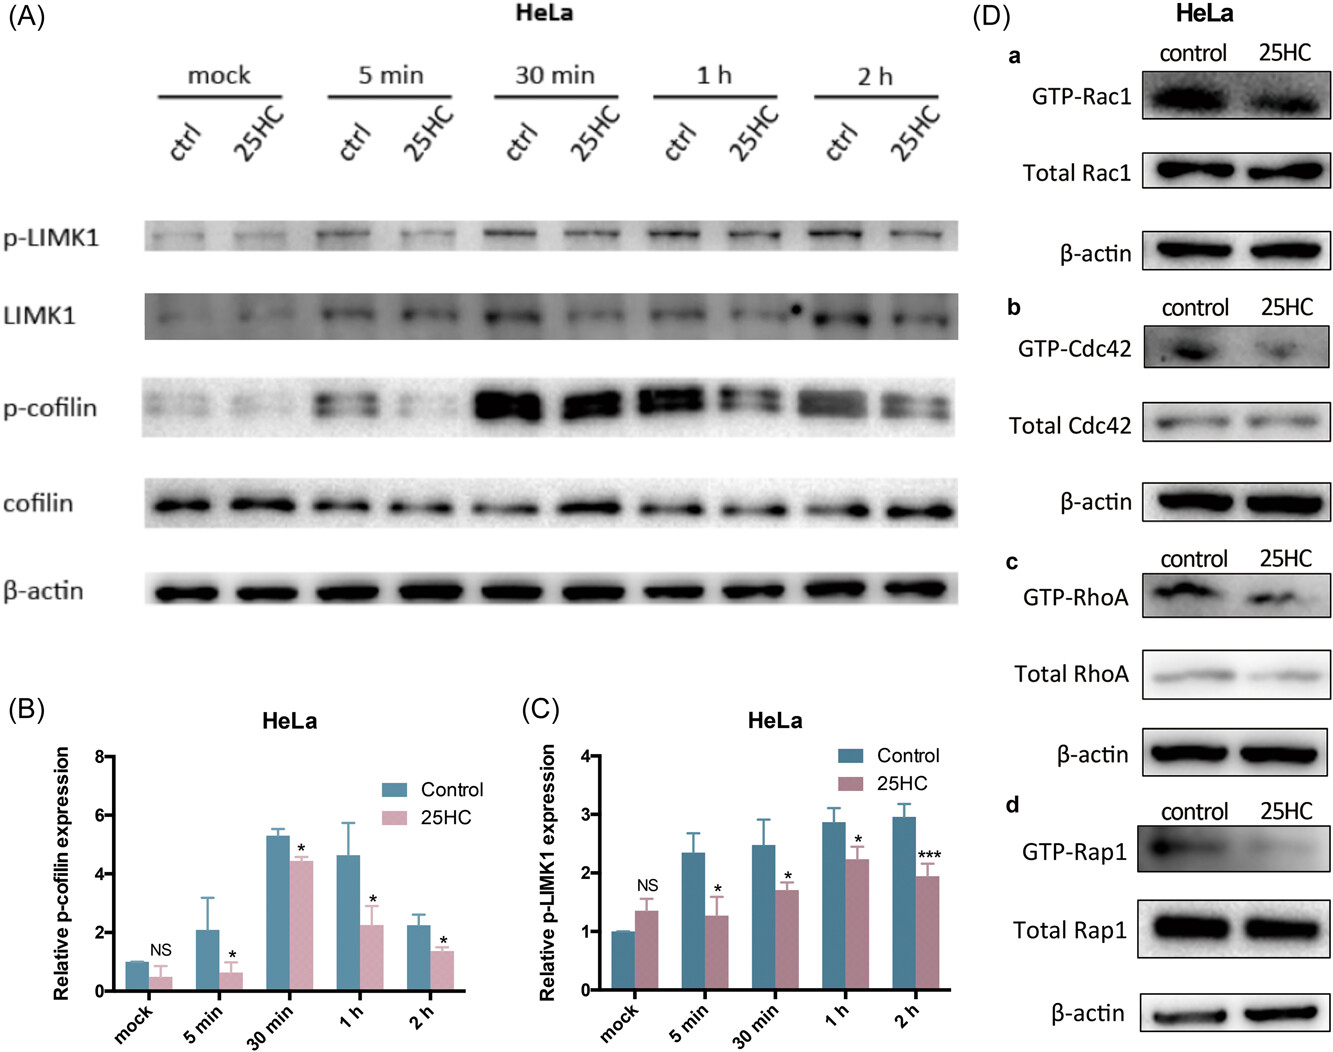
25HC suppresses small molecular weight GTPase activity, resulting in inhibition of LIMK/cofilin phosphorylation activity during HPV infection.
(A) Proteins of HeLa cells were collected at different time points post-HPV16 PsV infection for Western blot evaluation. Phosphorylated LIMK1 was increased by HPV inoculation. Cofilin phosphorylation also increased within 5 min postinfection, but decreased after 2 h. However, in 25HC-treated cells, at each time point, phosphorylation levels of LIMK1 and cofilin were lower than those observed in the control group. β-actin was used as loading control. (B)(C) Grayscale values of the Western blots were evaluated. Relative intensity of p-cofilin and p-LIMK1 was normalized to β-actin and standardized relative to mock of the control group. The differences between control group and 25HC group at each time point were calculated. Data are shown as the mean ± SD. (NS, non-significance; *p < 0.05; **p < 0.01; ***p < 0.001). (D) Equal amounts of HeLa cell lysates in the absence or presence of 25HC were used to capture the GTP-bound form of Rho GTPases (Rac1, Cdc42, and RhoA) by affinity precipitation with GST-PBD beads and capture GTP-bound Rap1 by active Rap1 GTP monoclonal antibody. The active GTP-bound forms of Rac1, Cdc42, RhoA, and Rap1 were reduced by 25HC treatment.
Immunoprecipitation and Immunoblots
RPE/choroidal tissues and RPE cells were lysed in radio immunoprecipitation assay buffer (RIPA) (20 mmol/l Tris pH 7.4, 120 mmol/l NaCl, 0.5% sodium deoxycholic acid, 1% Triton X-100, 0.1% SDS, 10% glycerol) with protease inhibitor cocktail (Roche Diagnostics, Indianapolis, IN) and phosphatase inhibitor orthovanadate (2 mmol/l, Sigma-Aldrich, St. Louis, MO). Lysates were centrifuged at 13,000 rpm for 5 minutes at 4 °C. Protein concentration in the supernatant was quantified by bicinchoninic acid assay (BCA) (Pierce, Rockford, IL). Thirty micrograms of protein from RPE/choroids were loaded into 4 to 12% NuPAGE Bis-Tris gels (Invitrogen, Carlsbad, CA), and transferred to a PVDF membrane (Invitrogen), incubated with antibodies to VEGF and phosphorylated ERK (1:500, Santa Cruz Biotechnology, Santa Cruz, CA), and Rap1 and pan-cadherin (1:1,000, Cell signaling Technology, Danvers, MA) overnight at 4 °C.
For coimmunoprecipitation (CO-IP), total protein (500 µg in 500 ml) for each sample was incubated with antibody to β-catenin (1:100, Cell signaling Technology), IQGAP1 (1:100, BD Transduction Laboratories, Franklin Lakes, NJ) or pan-cadherin (1:100, Cell signaling Technology) by gently rocking at 4 °C overnight with 10 µl of Dynabeads protein G (Invitrogen). The antibody/protein/agarose complex was washed three times with RIPA buffer and resuspended in 2× sample buffer. Protein complex was separated by NuPAGE 4 to 12% Bis-Tris Gels (Invitrogen) and transferred to a PVDF membrane and then incubated with antibodies to pan-cadherin (1:1,000) for CO-IP of β-catenin/cadherin, β-catenin (1:1,000) for CO-IP of pan-cadherin/β-catenin or CO-IP of IQGAP1/β-catenin, or phosphoserine/threonine (1:1,000, BD Transduction Laboratories) for phosphorylated IQGAP1 overnight at 4 °C. All membranes were reprobed with anti-β-catenin, anti-IQGAP1 or anti-pan-cadherin to ensure equal β-catenin, IQGAP1 or pan-cadherin protein loading.
For Rap1 activity assay in RPE cells, 300 µg of protein from each treatment was incubated with anti-GTP-Rap1 antibody (NewEast, Malvern, PA) and Dynabeads protein G at 4 °C overnight. Bead-bound active Rap1 was determined by western blots using a monoclonal antibody against Rap1 (BD Transduction Laboratories).
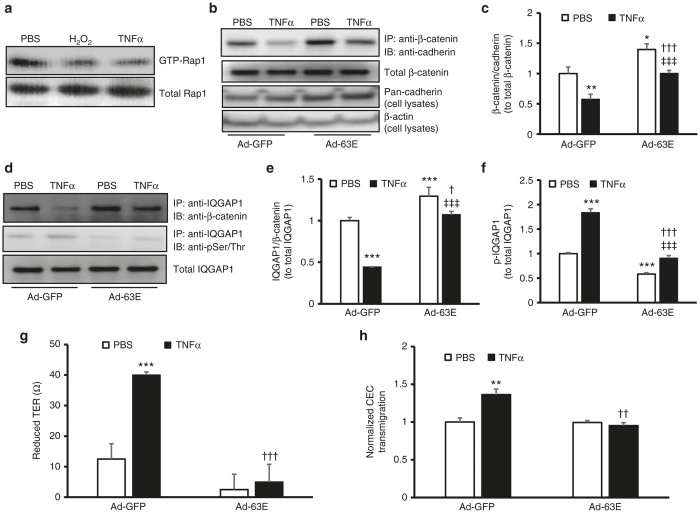
Expression of active Rap1a in RPE cells reduces cell barrier compromise from TNFα by modulating IQGAP1 interactions with β-catenin and IQGAP1 phosphorylation.
Rap1 activity assay in (a) retinal pigment epithelial (RPE) cells exposed to PBS, H2O2 (10 µmol/l), or human recombinant TNFα (20 ng/ml) overnight and (b) and (c) coimmunoprecipitation of β-catenin and pan-cadherin and western blot of pan-cadherin (b, representative gel images and c, quantification of densitometry of b; fold change over Ad-GFP/PBS) and (d–f) coimmunoprecipitation of IQGAP1 and β-catenin and phosphorylation of IQGAP1 in RPE cells transduced with Ad-GFP or Ad-63E and treated with PBS or TNFα (20 ng/ml) for 5 hours (d, representative gel images and e and f, quantification of densitometry of d) (g) Transepithelial resistance (TER) and (h) normalized CEC transmigration (fold change over Ad-GFP/PBS) of RPE cells transduced with Ad-GFP or Ad-63E and treated with PBS or TNFα (20 ng/ml) for 24 hours (*P < 0.05, **P < 0.01 and ***P < 0.001 versus Ad-GFP/PBS; †P < 0.05, ††P < 0.01 and †††P < 0.001 versus Ad-GFP/TNFα and ‡‡‡P < 0.001 versus Ad-63E/PBS).
Active Rap1 Detection
After nephrin activation by clustering, cells were directly cooled down on ice, media was removed, and cells were washed with ice-cold PBS. Cells were then lysed in 500 µl ice-cold IP buffer (20 mM Tris-HCl, pH 7.4; 20 mM NaCl; 1 mM EDTA; 50 mM NaF; 15 mM Na4P2O7; 1% (v/v) Triton X-100) containing protease inhibitor (cOmplete™ protease inhibitor cocktail, Roche Diagnostics) and phosphatase inhibitors (phosphatase inhibitor cocktail 2 and phosphatase inhibitor cocktail 3, Sigma Aldrich) and manually scratched from the plates. Further mechanical lysis was achieved by dragging the lysates through a 26, G needle. Lysates were kept on ice for 30 min, whereby they were vortexed every 3 to 5 min and were then centrifuged for 15 min at 14.000 × g and 4°C. The supernatant was transferred into a new reaction tube containing Sepharose G beads (GE Healthcare), which were washed three times for 5 min rotating in 1 ml IP buffer. 5% of the lysate was kept aside as input. 1 µl of active Rap1-GTP antibody (#26912, NewEast Biosciences) was added to 30 µl of beads slurry and lysate. Immunoprecipitation was performed rotating at 4°C for 1 h. Afterward, beads were washed three times at 4°C, rotating with 1 ml IP buffer each time, containing protease and phosphatase inhibitors. Following the washing steps 2× Laemmli was added to the beads, and the samples were boiled at 95°C for 5 min. Immunoblotting was performed as previously described (Dlugos et al., 2019). Primary antibodies were diluted 1:1000 in 5% bovine serum albumin in TBST.
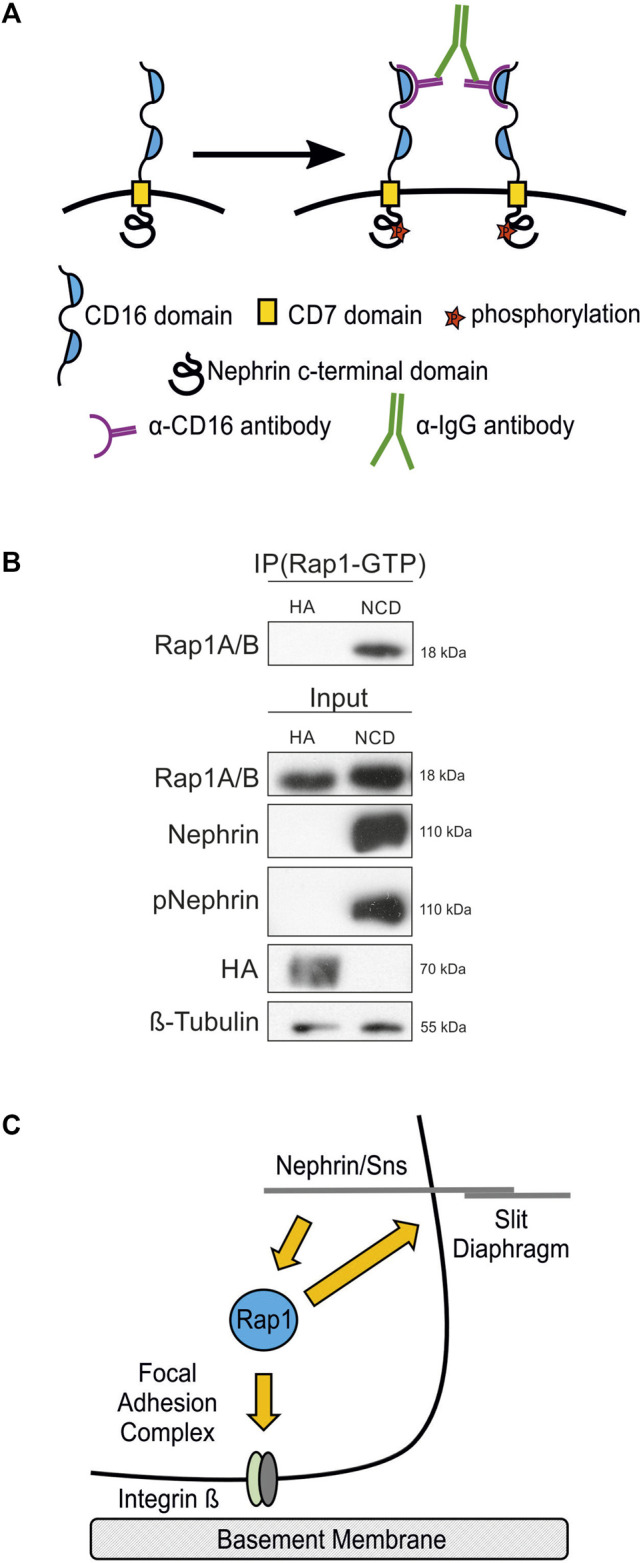
Nephrin activation results in increased active Rap1 in human podocytes.
(A) A nephrin clustering assay was performed by adding anti-CD16 antibody and secondary anti-IgG antibody to the media of cultured podocytes, which induces clustering of nephrin proteins followed by recruitment of Src kinases and consecutive phosphorylation of nephrin on tyrosine residues. (B) Immunoblot with antibodies specific for Rap1A/B following immunoprecipitation (IP Rap1-GTP) with an antibody specific for active Rap1A/B of podocyte lysates. Employed were human podocyte lines that inducibly express either chimeric CD16-CD7-nephrin cytoplasmic domain (NCD) or CD16-CD7-HA (HA) as a control following doxycycline treatment followed by clustering of nephrin. Immunoblots of these lysates were also performed with antibodies specific for Rap1A/B, nephrin, phospho-nephrin (pNephrin), HA, and β-tubulin (Input), n = 3. (C) Schematic of the hypothesis that the small GTPase Rap1 functions downstream of nephrin in signaling to integrin β at focal adhesions and in signaling at the slit
Rap1 activity measurement
Briefly, Goat Anti-Mouse IgG Magnetic Beads (S1431S, New England Biolabs, Ipswich, MA) were washed with lysis buffer and incubated with milk for 15 min. The anti-active Rap1a (26912, NewEast Biosciences, King of Prussia, PA) were then added and incubated for 30 min. The active Rap1 antibody suspension was washed and resuspended in difference lysis buffer separately. 100ul active Rap1 antibody suspension above were added to the tubes containing 900uL of human B cells lysate and incubated with rotation for 30 min at 4°C. The samples with beads above were pelleted using magnet, and washed twice. The remaining buffer were removed carefully.
The samples with beads above were resuspended in 1X Laemlii with reducing agent TCEP (tris(2-Carboxyethyl) phosphine), and were boiled to remove beads at 95°C for 5min. The samples were harvested for western blot. For the positive control use GTPyS containing lysis buffer, negative control use GDP containing lysis buffer, and experimental samples above need to be washed with buffer containing GTP and GDP.
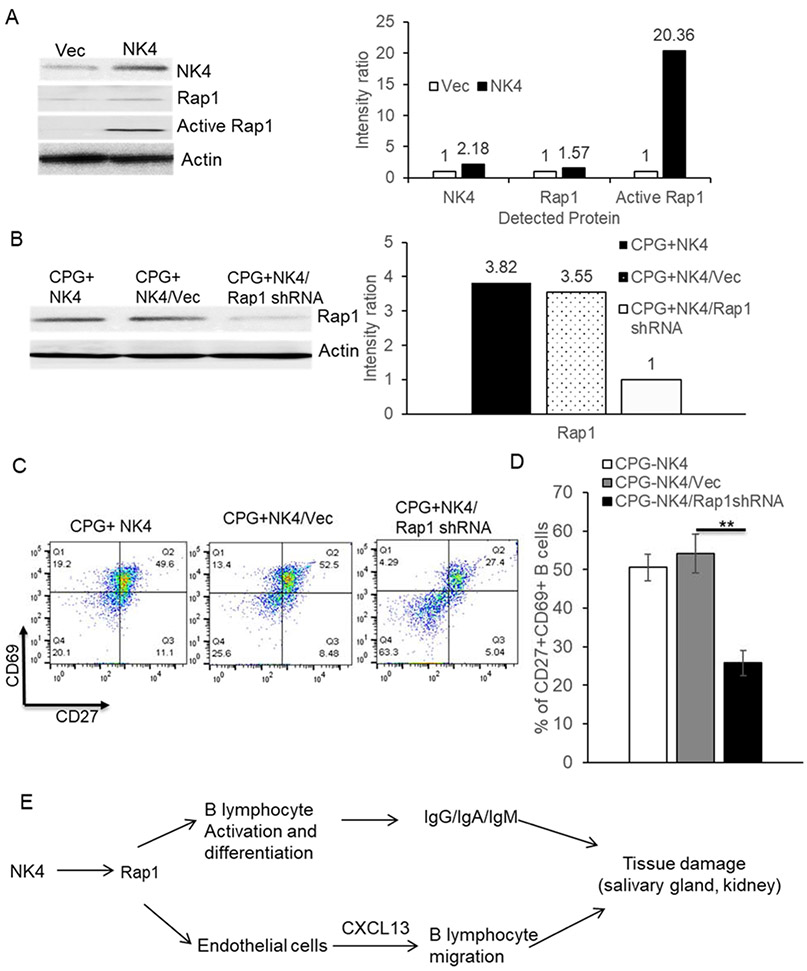
NK4 regulates naïve B cells activation through upgrading Rap1 activity.
(A) Naïve B cells were transfected with empty vector or NK4, NK4 and Rap1 protein were measured using western blotting. For detection of Rap1 activity, the protein was measured with activated Rap1 antibody, after IP, according to the Rap1 activity measuring protocol. The band intensities of WB were analyzed using imageJ software. The intensity ratios were calculated. (B) Rap1 protein was detected via western blotting, after naïve B cells were transfected with NK4 in the presence of empty shRNA or Rap1a shRNA for 6 days. Both representative WB results and their band intensity ratios were shown. (C) CD69 and CD27 expression on B cells above (B) were also measured. (D) graph data are from three independent experiments. *, P<0.05, **p<0.01. (E) One diagram of putative signaling pathway, by which NK4 regulates B cell differentiation and further induce autoimmune phenotypes such as tissues damage via upgrading Rap1 activity.
For Rap1 activity assay in RPE and choroid, 500 μg of protein from each treatment was incubated with anti-GTP-Rap1 antibody (NewEast, Malvern, PA, USA) and Dynabeads protein G at 4°C overnight. Bead-bound active Rap1 was determined by Western blots using a monoclonal antibody against Rap1 (BD Transduction Laboratories). Rap1 activity was calculated as a ratio of active Rap1/total Rap1 in retinal samples. Densitometry analysis was done on exposed films with the use of the software UN-SCAN-IT 6.1 (Silk Scientific, Orem, UT, USA).
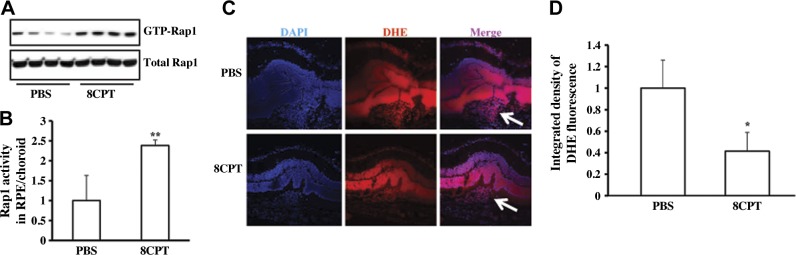
Activation of Rap1 by 8CPT inhibits ROS generation in RPE/choroid surrounding CNV lesions.
A, B) Immunoprecipitation of active Rap1 in RPE/choroid of mice injected with PBS or 8CPT: representative gels (A) and quantification (B) of Rap1 activity. **P < 0.01 vs. PBS, n = 5. C) Images of DHE staining in RPE/choroid surrounding CNV lesions. Red denotes DHE; blue denotes DAPI; purple denotes DHE + DAPI; Arrow indicates area of CNV lesion. D) Quantification of DHE fluorescence density. *P < 0.05 vs. PBS, n = 12.
Immunohistochemistry
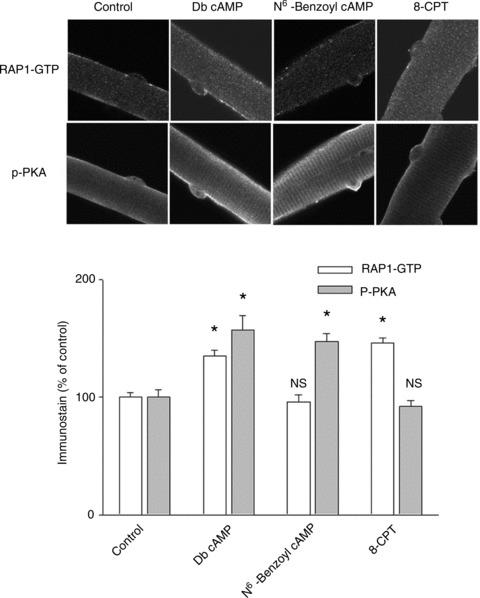
FDB fibre cultures were fixed with 4% paraformeldehyde. The cultures were immunostained with primary antibodies against phosphorylated/activated PKA catalytic subunit (Thr 198, from Santa Cruz Biotechnology), active Rap1 (from NewEast Biosciences) which recognizes the GTP-bound Rap1, phosphorylated CaMKII (Thr 286, from Santa Cruz Biotechnology) or HDAC4 (from Santa Cruz Biotechnology).
Monitoring Epac and PKA activation
Muscle fibres were treated as indicated and immunostained for both phosphorylated PKA catalytic subunit and GTP-bound RAP1, which reflect activated PKA or activated Epac, respectively. In Db cAMP-treated fibres, both activated PKA and activated Epac are enhanced significantly. In N6-benzoyl cAMP-treated fibres, only activated PKA is increased, while in the same fibres there is no change in the activation of PKA. In 8-CPT-treated fibres, only activated Epac is increased, with no changes in the activation of PKA (NS: P > 0.05; *P < 0.01 compared with control). Data are from 21 to 27 fibres in each group of 3 mice.
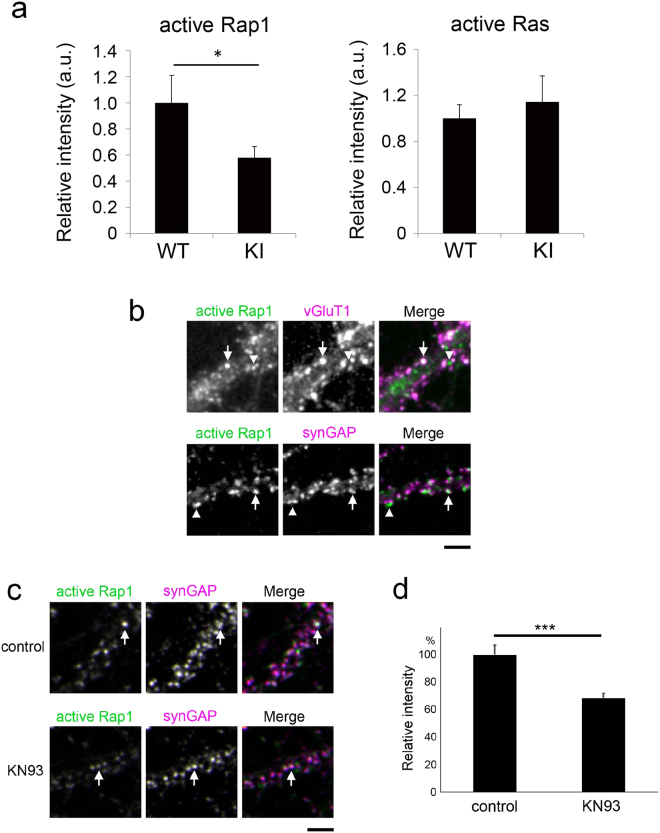
CaMKII-dependent regulation of Rap1 activity.
(a) Quantification of active Rap1 and active Ras immunoreactivity in the dendrites of CaMKIIα KI or wild-type neurons. Data are presented as the mean ± SEM, (neurons at 21–22 DIV, Rap1; n = 42 and 27 cells from 4 independent cultures of wild-type and CaMKIIα KI hippocampi, Ras; n = 32 and 33 cells from 5 independent cultures of wild-type and CaMKIIα KI hippocampi), *p < 0.05, t-test. (b) Immunoreactivity of active Rap1 in the dendrites of hippocampal neurons at 22–23 DIV and immunostaining for the presynaptic marker vGluT1 or the postsynaptic marker synGAP. Active Rap1-positive punctae are either colocalized with (arrows) or separated from (arrowheads) the synaptic markers. Bar, 5 µm. (c) Immunocytochemistry of KN93-treated neurons exposed to the anti-active Rap1 antibody. The intensity of active-Rap1 punctae at synGAP-positive postsynaptic sites was lower in neurons treated with KN93 (arrows). Bar, 5 µm. (d) Quantification of active Rap1 immunoreactivity at synGAP-positive postsynaptic sites indicates that Rap1 activity is negatively regulated by KN93. Data are presented as the mean ± SEM, (neurons at 20–22 DIV, n = 22 cells from 3 independent cultures for both control (KN92) and KN93 treatment), ***p < 0.001, t-test.
Immunoprecipitation
The cells were washed three times in cold PBS. The cold radioimmunoprecipitation assay (RIPA) lysis buffer containing protease inhibitors and phosphatase inhibitors was added to each well. The cells were transferred into 1.5 mL Eppendorf tubes and the lysates were centrifuged by rotating at 4℃ for 10 min at 16000 × g. Immunocoprecipitation was performed by combining cell lysate proteins with 10 μL Dynabeads protein G (Invitrogen, Carlsbad, CA) and mouse anti-RAP1-GTP antibodies (NewEast Bioscience, King of Prussia, PA), followed by incubating overnight and lightly rotating at 4 °C. The complex was washed 6 times with the RIPA cracking buffer, re-suspended in the 2 × loading buffer, and denatured at 95 °C for 5 min.
Western blotting
Suitably transfected cells were cultured for 48 h and lysed with RIPA buffer supplemented with a proteinase/phosphatase inhibitor cocktail. The lysates were separated by 10% SDS–PAGE and transferred to PVDF membranes. After blocking for 1 h with PBST containing 5% skim milk, the blots were incubated overnight with the appropriate primary antibodies at suitable dilutions. The protein bands were probed with horseradish peroxidase (HRP)-conjugated secondary antibodies, and the positive bands were visualized using Pierce ECL Western blotting Substrate (Thermo Scientific). The density of the bands was analyzed using ImageJ software (version 1.8.0). ACTIN was used as the internal control.
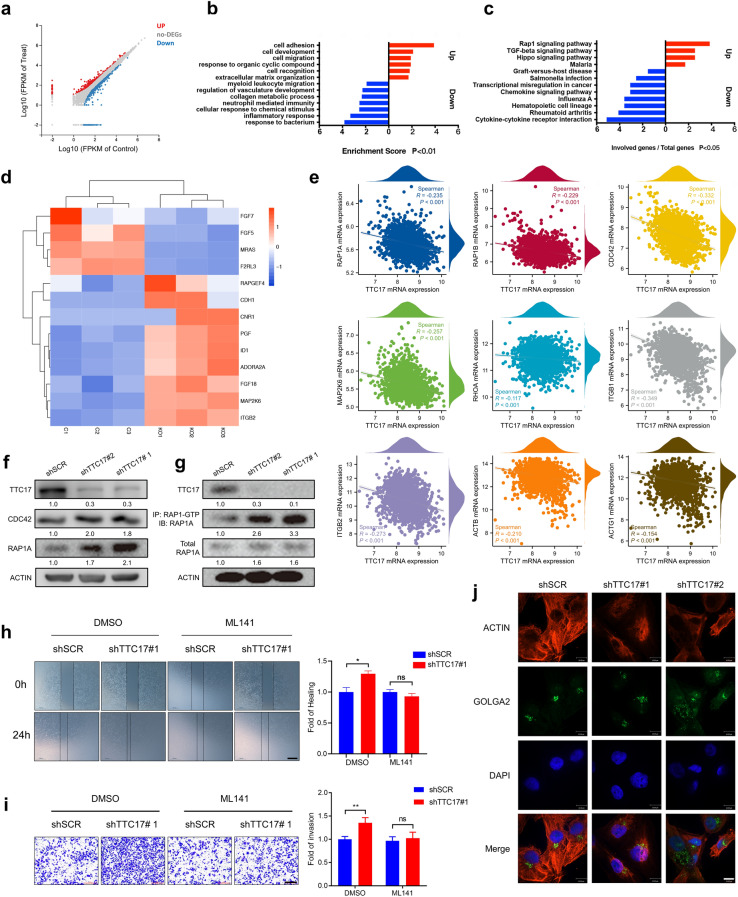
Activation of RAP1/CDC42 signaling is required for TTC17 deficiency to facilitate metastasis.
a Profile of DEGs (logFC > 1.5, FDR < 0.05) between TTC17-knockout MDA-MB-231 cells and control cells. b Enrichment of GO biological processes for up- and downregulated genes. c Enrichment of KEGG pathways for up- and downregulated genes. d Heatmap of key molecules in the RAP1 signaling pathway enriched by DEGs described in Fig. 4a. e mRNA expressional correlation of TTC17 with members of the RAP1/CDC42 cascade in breast cancer, including RAP1A, RAP1B, CDC42, MAP2K6, RHOA, ITGB1, ITGB2, ACTB, and ACTG1. f, g Western blot analysis of RAP1/CDC42 signaling activation in MDA-MB-231 cells with or without TTC17 knockdown by increased RAP1A, CDC42 (f), and RAP1A-GTP (g). h, i Representative images and quantitative analysis of wound healing assays (h) and Transwell invasion assays (i) using TTC17-silenced MDA-MB-231 cells treated with the CDC42 inhibitor ML141 and their counterparts. Scale bars, h 500 μm; i 200 μm. j Representative immunofluorescence images of actin cytoskeleton and Golgi morphology in MDA-MB-231 cells with TTC17 silencing or scramble control. Scale bar, 10 μm. *P < 0.05, **P < 0.01, ***P < 0.001. DEGs, differentially expressed genes; FDR, false discovery rate; GO, Gene Ontology; KEGG, Kyoto Encyclopedia of Genes and Genomes; BRCA, breast invasive carcinoma
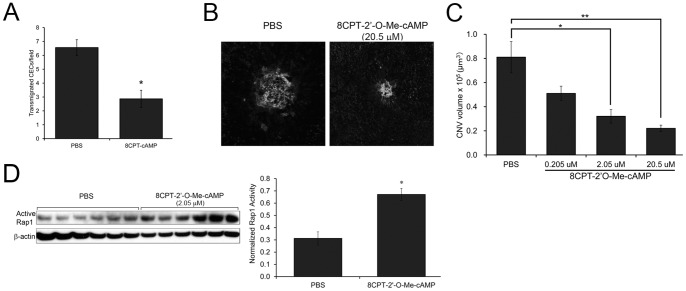
Rap1 Activity Assays
Three to four hours following laser injury and intravitreal injection of 8CPT-cAMP (2.05 µM) or PBS, RPE/choroids were isolated from euthanized mice, and lysed and homogenized by sonication in RIPA buffer. Supernatants were used for Western blotting using an antibody specific for active (GTP-bound) Rap1 (NewEast, PA), and β-actin (Santa Cruz, CA). Digitized images of Western blots were quantified using UN-SCAN-IT gel 6.1 (Silk Scientific) and normalized to β-actin.
CEC transmigration across RPE monolayer (in vitro) and CNV volume (in vivo) are inhibited with 8CPT-cAMP treatment.
(A) In vitro, CECs have decreased transmigration across RPE monolayers when RPE are incubated with 8CPT-CAMP. Representative experiment of 2 independent trials. Data plotted as the average number of transmigrated CECs (± SEM) per 3 random fields, n = 6 Transwells per condition. * p<0.001 (B) Representative confocal images (maximum projections) of lectin-stained RPE/choroid flat mounts, 1 week post laser and intravitreal injection of PBS or 20.5 µM 8CPT-cAMP. (C) Quantification: intravitreal injection of 8CPT-cAMP induces a dose-dependent decrease in CNV volume in compared to PBS-injected control. *p<0.01, **p<0.001 (n = 13–21 lesions per condition) (D) Intravitreal injection of 8CPT-cAMP activates Rap1 in vivo. RPE/choroid was dissected and lysates were blotted with an antibody that detects active Rap1 (GTP-bound), or β-actin as loading control. Graph shows densitometry of active Rap1 normalized to β-actin (average ± SEM, n = 6). * p<0.0001.
Western blots
RPE/choroid tissues were triturated, lysed on ice in RIPA buffer, and boiled in SDS loading buffer. Protein extracts were subjected to 6–12% SDS-PAGE and processed with a standard protocol. Primary antibodies for GTP-Rap1 (1:1000, NewEast Biosciences, King of Prussia, PA, USA), vascular endothelial growth factor (VEGF, 1:1000, Santa Cruz Biotechnology, Santa Cruz, CA, USA), zonula occludens-1 (ZO-1, 1:2000, Santa Cruz Biotechnology), occludin (1:2000, Santa Cruz Biotechnology), NADPH oxidase 4 (NOX4, 1:1000, Abcam, Cambridge, UK), and β-actin (1:4000, Abclone, Wuhan, China) were used.
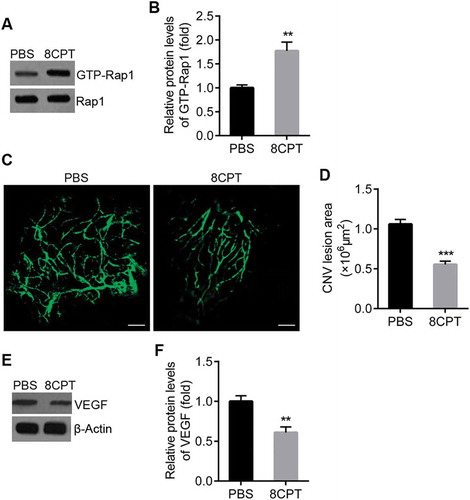
Rap1 activation inhibits laser-induced CNV in rats.
A. Western blot of GTP-Rap1 in RPE/choroid tissues from CNV rats with PBS and 8CPT injection. B. Quantification of results in A. Protein levels normalized against Rap1, n = 3. **P < 0.01. C. Representative confocal images of RPE/choroid flat mounts stained with FITC-dextran in PBS and 8CPT groups. Scale bar = 100 μm. D. Quantification of CNV area. n = 10 lesions. ***P < 0.001. E. Western blot of VEGF in RPE/choroid tissues from CNV rats with PBS and 8CPT injection. F. Quantification of results in E. Protein levels normalized against β-actin, n = 3. **P < 0.01.
RAP1-GTP pulldown assay
Cells were lysed with RIPA buffer with protease and phosphatase inhibitors. The pull down was performed as described [22] using Active Rap1 Pull-Down and Detection Kit (Sigma-Aldrich, St. Louis, MO). Briefly, cell lysates were incubated with GST-Rap-binding domain (RBD) and then pulled down using anti-GST antibody and used to validate anti-Active RAP1 antibody (New East Biosciences, Malvern, PA).
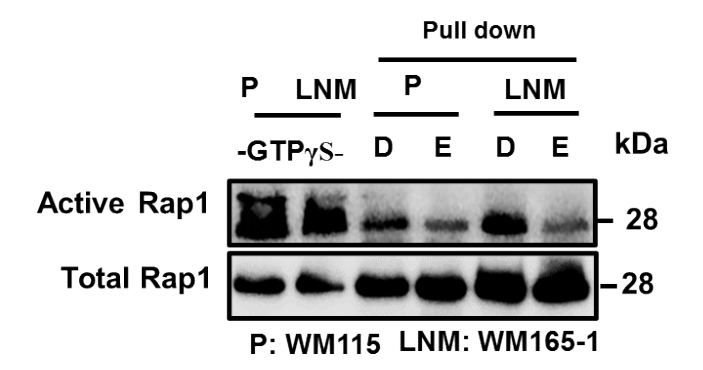
Validation of anti-active RAP1 (RAP1-GTP) antibody.
Total cell lysates (500µg protein) of WM115 and WM165-1 were treated with the GTPγS (non-hydrolyzable GTP). The lysates were then incubated with GST-RalGDS-RBD to pull down GTP-bound RAP1. (30µL eluted samples and 30µg of total cell lysate were subjected to SDS-PAGE (15% acrylamide) and probed with ant-active RAP1 antibody (New East Biosciences Inc., Mavern, PA).
Immunocytochemistry
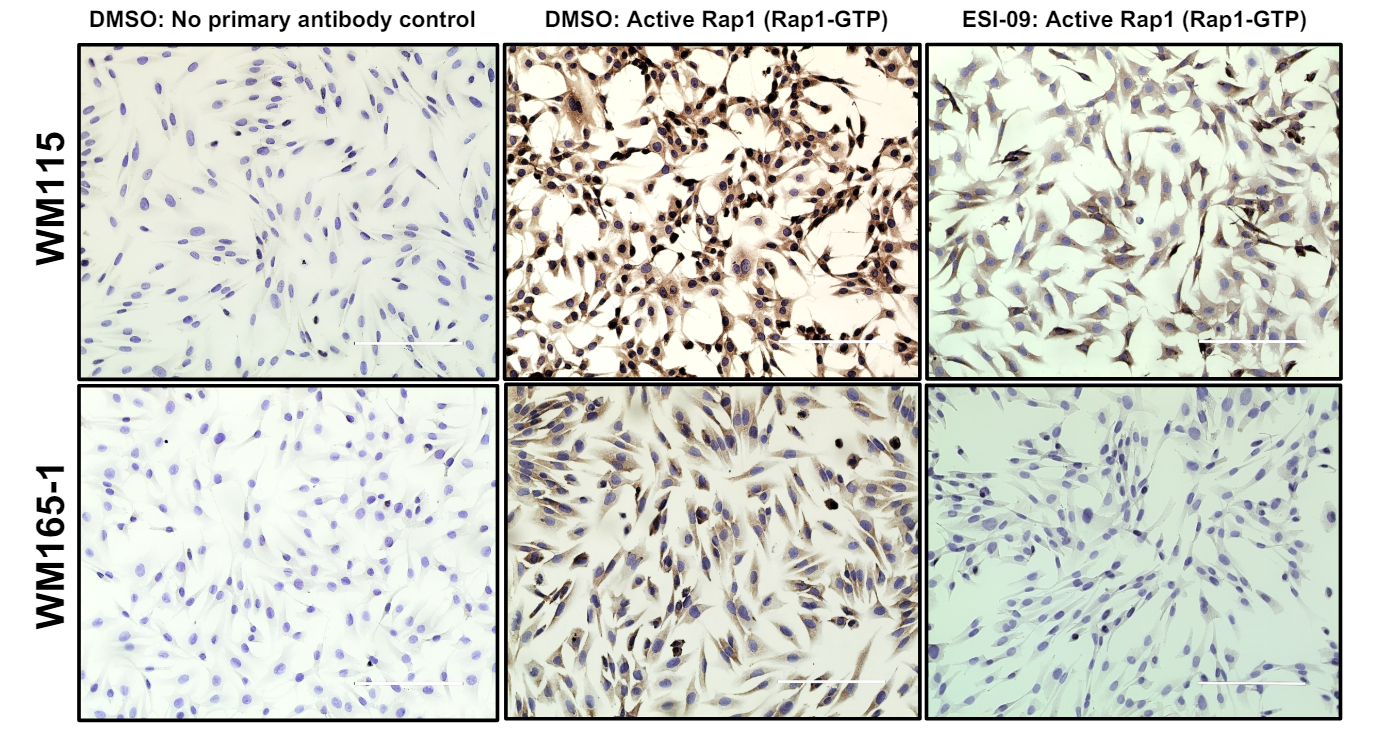
Cells were plated on 8-well slides (Ibidi, USA, #80826) and after 24hours cells were treated with DMSO or ESI-09 for 24hours. Next day, the cells were fixed in 4% paraformaldehyde in PBS for 15 min. Fixed cells were treated with 0.3% H2O2 for 10 min followed by incubation in Ultra V Block (UltraVision LP Detection System, Thermo Fisher Scientific) for 10 min at room temperature and then in permeabilization/blocking buffer (0.3% Triton X-100, 1% BSA, and 10% normal donkey serum in PBS) for 45 minutes. The slides were incubated with anti-RAP1GAP antibody (Santa Cruz, Dallas, TX1:1000) or anti-active RAP1 mouse polyclonal antibody (New East Biosciences; 1:1000) diluted in permeabilization/blocking buffer overnight at 40 C. Next day, cells were washed 3 times with 1% BSA in PBS for 5 min and antibody binding was detected using UltraVision LP Detection System according to the manufacturer’s recommendations and cells were counterstained with hematoxylin.
Immunocytochemical staining for active RAP1. Matched primary (WM115) (top panels) and LNM melanoma cells (WM165-1) (bottom panels) cells were treated with DMSO or 2.5µM ESI-09 for 24h and then stained with anti-active RAP1 antibody (1:1000) followed by horse radish peroxidase conjugated universal secondary antibody (Ultravision LP Detection System, Thermofisher Scientific). Cells were counterstained with hematoxylin. Negative controls shown are cells stained the secondary antibody alone without the primary antiactive RAP1 antibody. Scale bar: 200μm.
Rap1 Activation Assay
The activation of Rap1 was examined by a Rap1 Activation Assay Kit (Neweastbio, USA). Briefly, The cell lysate was mixed with 20µL of resuspended protein A/G Agarose bead slurry with 1µL anti-active Rap1 monoclonal antibody and incubated at 4 °C for 1 h with gentle agitation. Following three washes in lysis buffer, the beads were suspended in 20 µL of 2X reducing SDS-PAGE sample buffer. 15 µL/well of pull-down supernatant were loaded onto a 12% polyacrylamide gel and further analyzed with western blot using Rap1 specific antibody
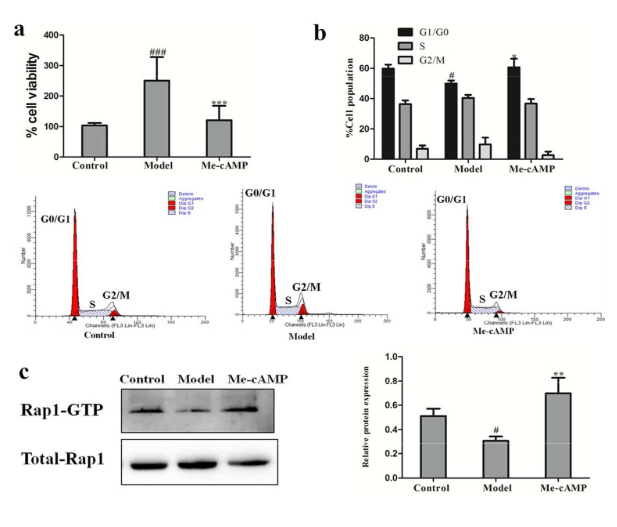
Cell proliferation was determined by MTT assay. b Cell cycle analysis of HSCs treated with acetaldehyde and Me-cAMP. c Rap1 activation (GTP-bound) was probed by western blot. # P < 0.05, ### P < 0. 001 vs. control group; * P<0.05, ** P < 0. 01, *** P < 0. 001 vs. model group.
Flow cytometry
For the intracellular staining, cells were fixed in 2% formaldehyde and permeabilized in 90% methanol. Antibody staining was performed in PBS/0.5% gelatin/10% goat serum at RT (primary Ab: 2 h or overnight; secondary Ab and Abs to surface antigens: 40 min). F-actin was stained in a single permeabilization/staining step with lysophosphatidylcholine (40 μg/mL) and phalloidin-Alexa Fluor488 (0.1 U/mL) at RT for 15 min. Staining of live cells was performed in PBS/0.5% gelatin on ice. LIVE/DEAD near-IR dye (Life Technologies) was used for discrimination of live and dead cells. Flow cytometry was carried out with an FACSCanto II or a LSRFortessa (BD Bioscience). Cell sorting was performed using an FACSAria III (BD Bioscience). Data were analyzed using FlowJo software (TreeStar).
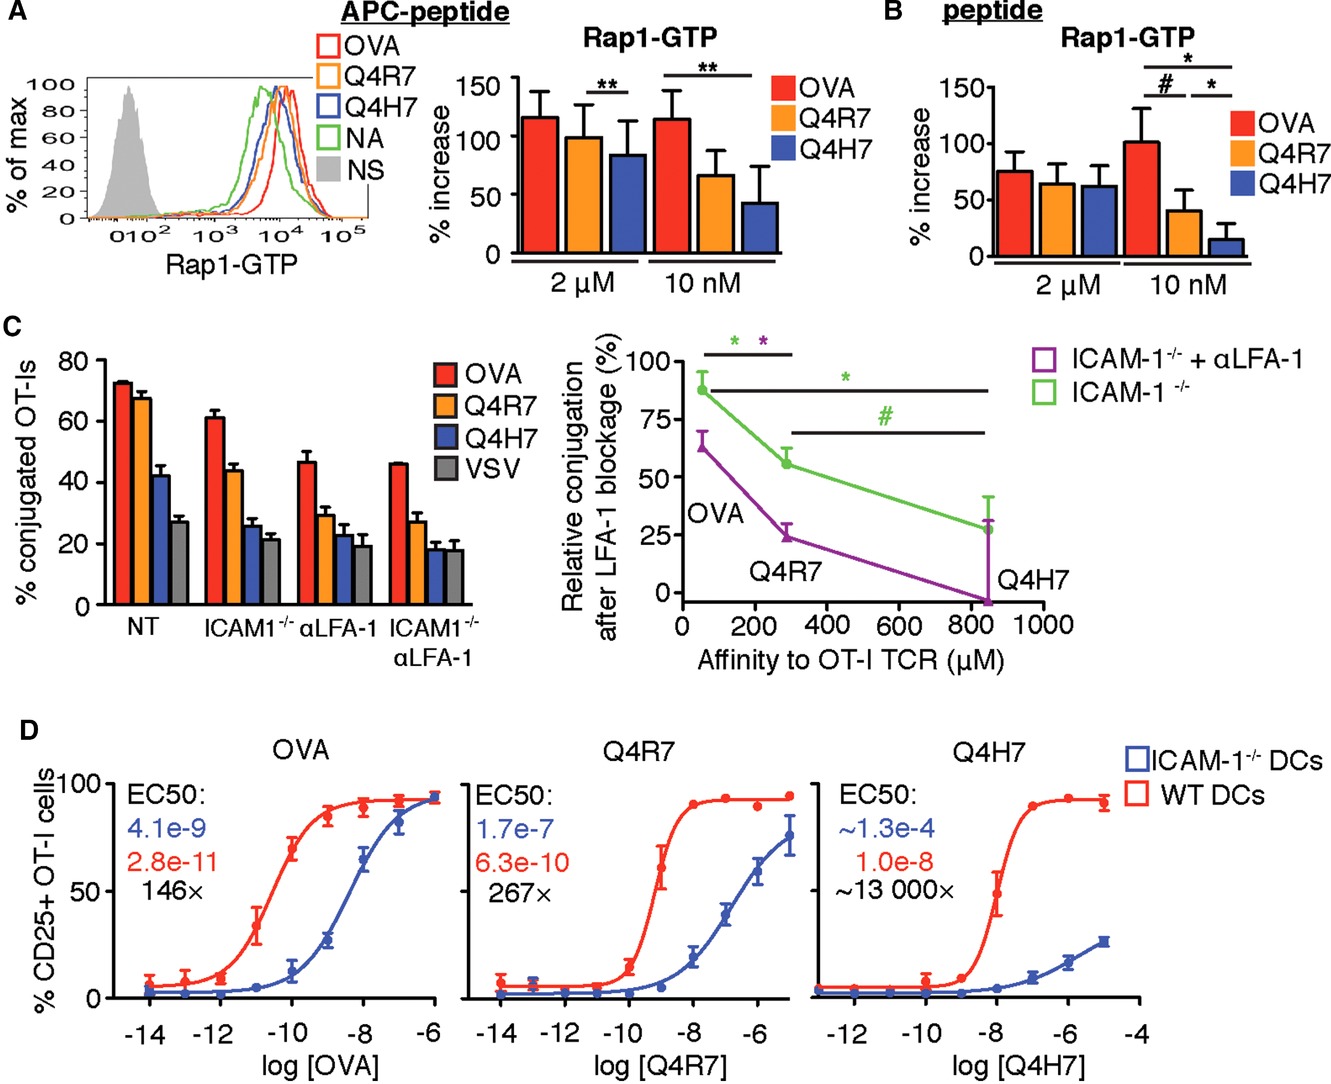
Signaling induced by low-affinity antigens is relatively more dependent on LFA-1 in comparison to high-affinity antigens. (A) DDAO+ OT-I T cells were activated by mixing with WT splenocytes preloaded with 2 μM or 10 nM peptide for 2 h. (B) OT-I T cells (5 × 10⁶ /mL) were activated by addition of 2 μM or 10 nM peptide for 90 min. (A and B) The level of GTP-bound Rap1 was analyzed by flow cytometry. Statistical significance was calculated using onetailed paired t-test; data are shown as mean+SEM from single samples pooled from n = 3 (A) or n = 5 (B) independent experiments. (C) CFSE+ OT-I T cells were mixed with DDAO+ WT or ICAM-1−/− splenocytes preloaded with a particular antigenic peptide (1 μM) in the presence or absence of 10 μg/mL anti-LFA-1 antibody. The percentage of T cells conjugated with APCs was determined by flow cytometry (left). Data shown as mean + SEM of single samples pooled from n = 3 independent experiments. The relative level of conjugation under LFA-1 blockage was calculated as a ratio (%conjugated cognate peptide LFA-1 blockage – % conjugated VSV control LFA-1 blockage) / (%conjugated cognate peptide untreated – % conjugated VSV control untreated) and plotted versus the antigen affinity (right) 4. Data shown as mean + SEM. Statistical significance was calculated using two-tailed paired t-test. (D) OT-I cells were activated with antigen pulsed BMDCs cells overnight. The percentage of CD25+ cells from CD8+ cells is shown. Data shown as mean ± SEM from single samples pooled from n = 4 independent experiments. EC50 for WT (red) and ICAM-1−/− DCs (blue) as well as their ratio (black) is shown. #p<0.1, *p<0.05, **p<0.01.
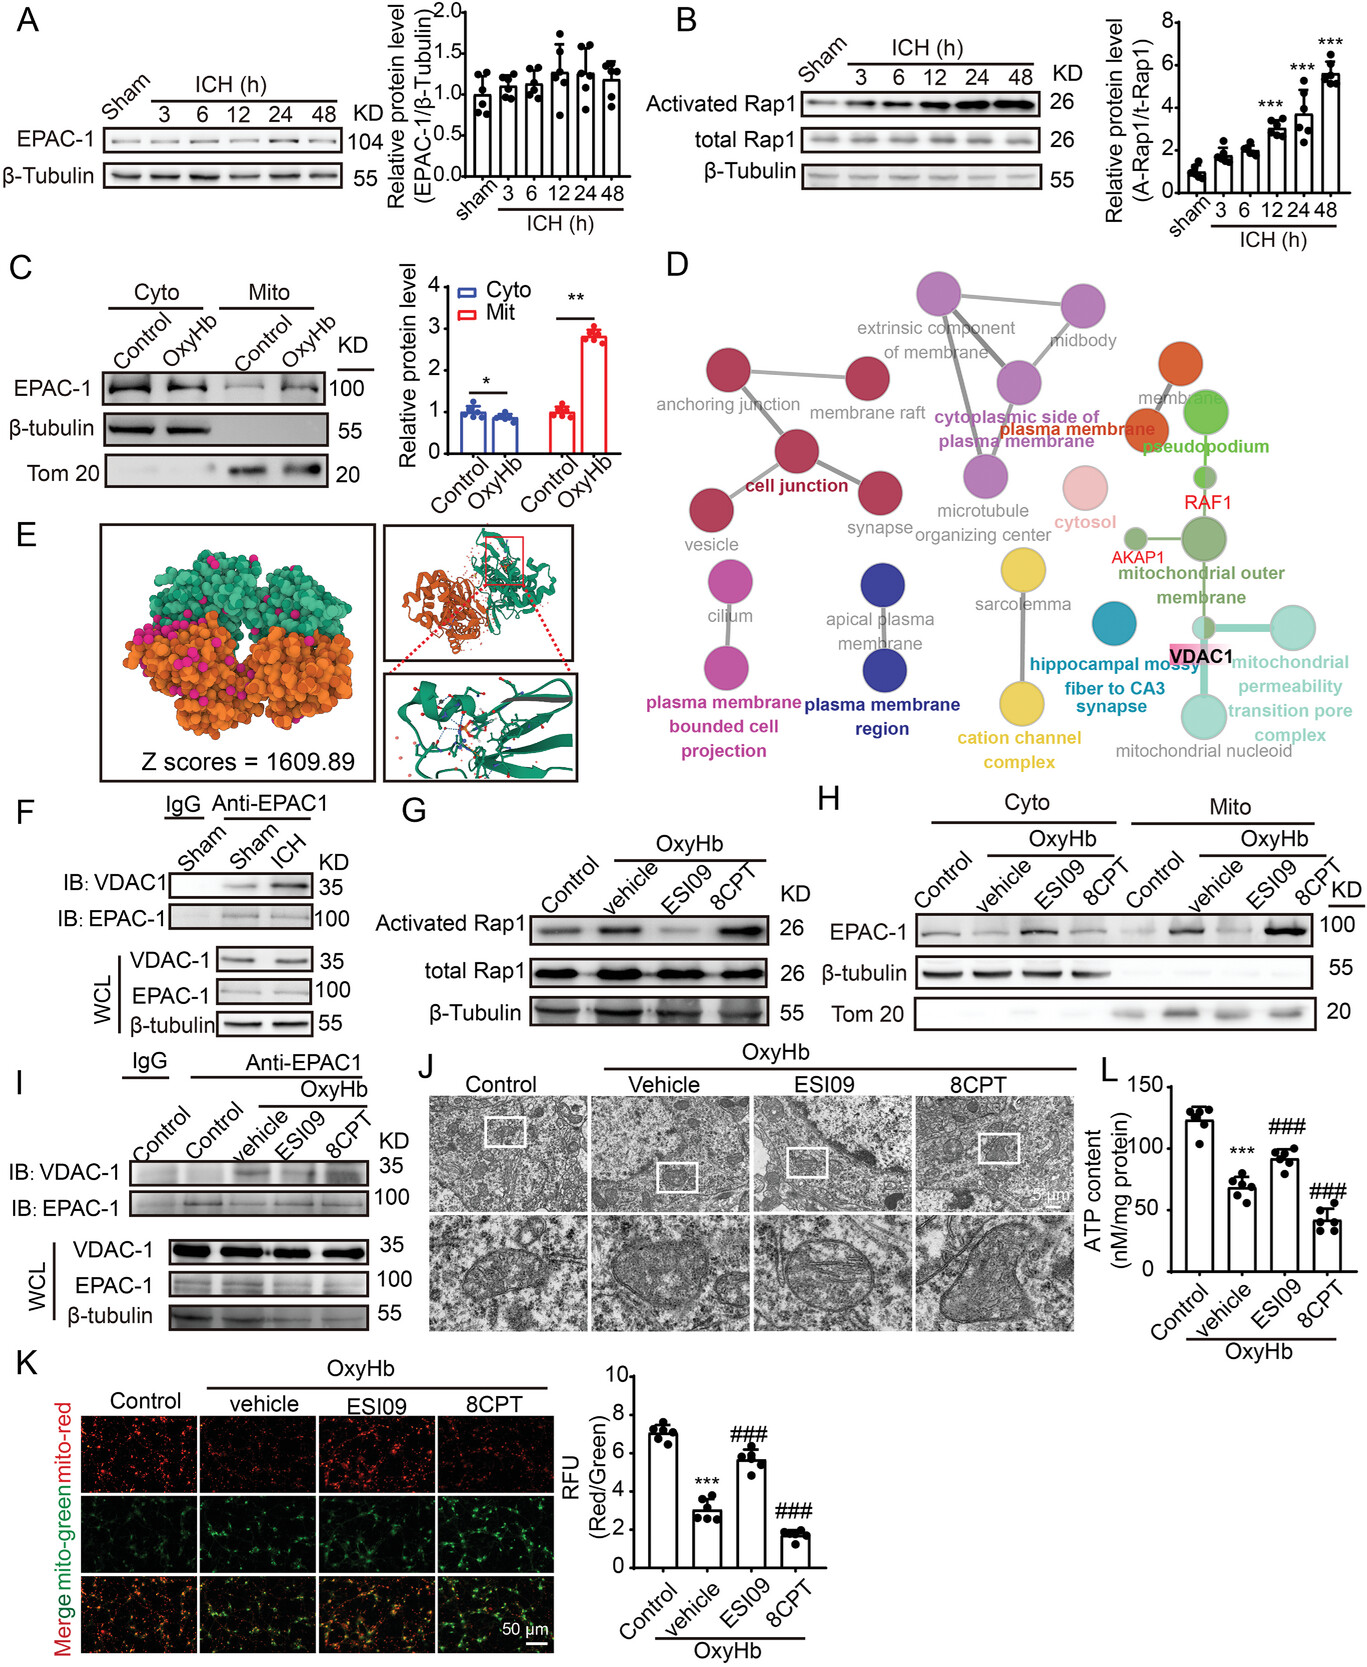
EPAC-1 contributes to mitochondrial dysfunction induced by ICH through its interaction with VDAC1.
A) Samples of cortex surrounding the hematoma in mice were collected at 3, 6, 12, 24, and 48 h post-ICH induction. The protein levels of EPAC-1 were assessed via western blot analysis, and the alterations in expression were quantified. β-Tubulin served as loading controls, with a sham group being normalized to a value of 1.0 for accurate comparisons (n = 6). B) EPAC-1 activation was assessed by measuring the levels of activated Rap1-GTP using a Rap1 Activation Assay Kit. β-Tubulin served as loading controls, with each sham group being normalized to a value of 1 for accurate comparisons n = 6. C) Neurons underwent a 12 h stimulation with 10 µm OxyHb. Subsequently, mitochondria and cytoplasm were isolated, and the protein levels of EPAC-1 in both compartments were evaluated using western blot analysis. β-Tubulin and Tom20 served as loading controls, with each control group being normalized to a value of 1 for accurate comparisons, n = 6. D) Protein-protein interaction (PPI) network was queried from the STRING database (https://string-db.org), followed by functional protein enrichment analysis conducted through Cytoscape and ClueGO. E) Rigid protein-protein docking (ZDOCK) was conducted to investigate the relationship between EPAC-1 and VDAC1. The PDB format of the protein structural domain was obtained from the Protein Data Bank (PDB) at http://www.rcsb.org/. The ZDOCK module was used to identify docking sites and calculate ZDOCK scores. F) Cortex samples surrounding the hematoma in mice were collected from sham and ICH 24 h groups, followed by co-immunoprecipitation to validate the interaction between EPAC-1 and VDAC-1. G,H) Following stimulation with 10 µm OxyHb for 12 h, neurons were treated with the EPAC-1 inhibitor ESI09 (10 µm) or activator 8CPT (10 µm) for 24 h. The levels of activated Rap1-GTP were detected using a Rap1 Activation Assay Kit (G), while EPAC-1 protein levels in both compartments were assessed via western blot analysis (H). Co-immunoprecipitation was used to detect the interaction between EPAC-1 and VDAC-1 I), and mitochondrial structures were examined by means of transmission electron microscopy with a scale bar of 5 µm J). The ATP content was quantified L), and mitochondrial membrane potential (MMP) was measured by JC-1 staining K). All data are presented as mean ± SD. Statistical significance was determined using one- or two-way ANOVA with Tukey’s multiple comparisons tests (n = 6, ***p < 0.0001 vs control/ sham group; ###p < 0.0001 vs Vehicle group).
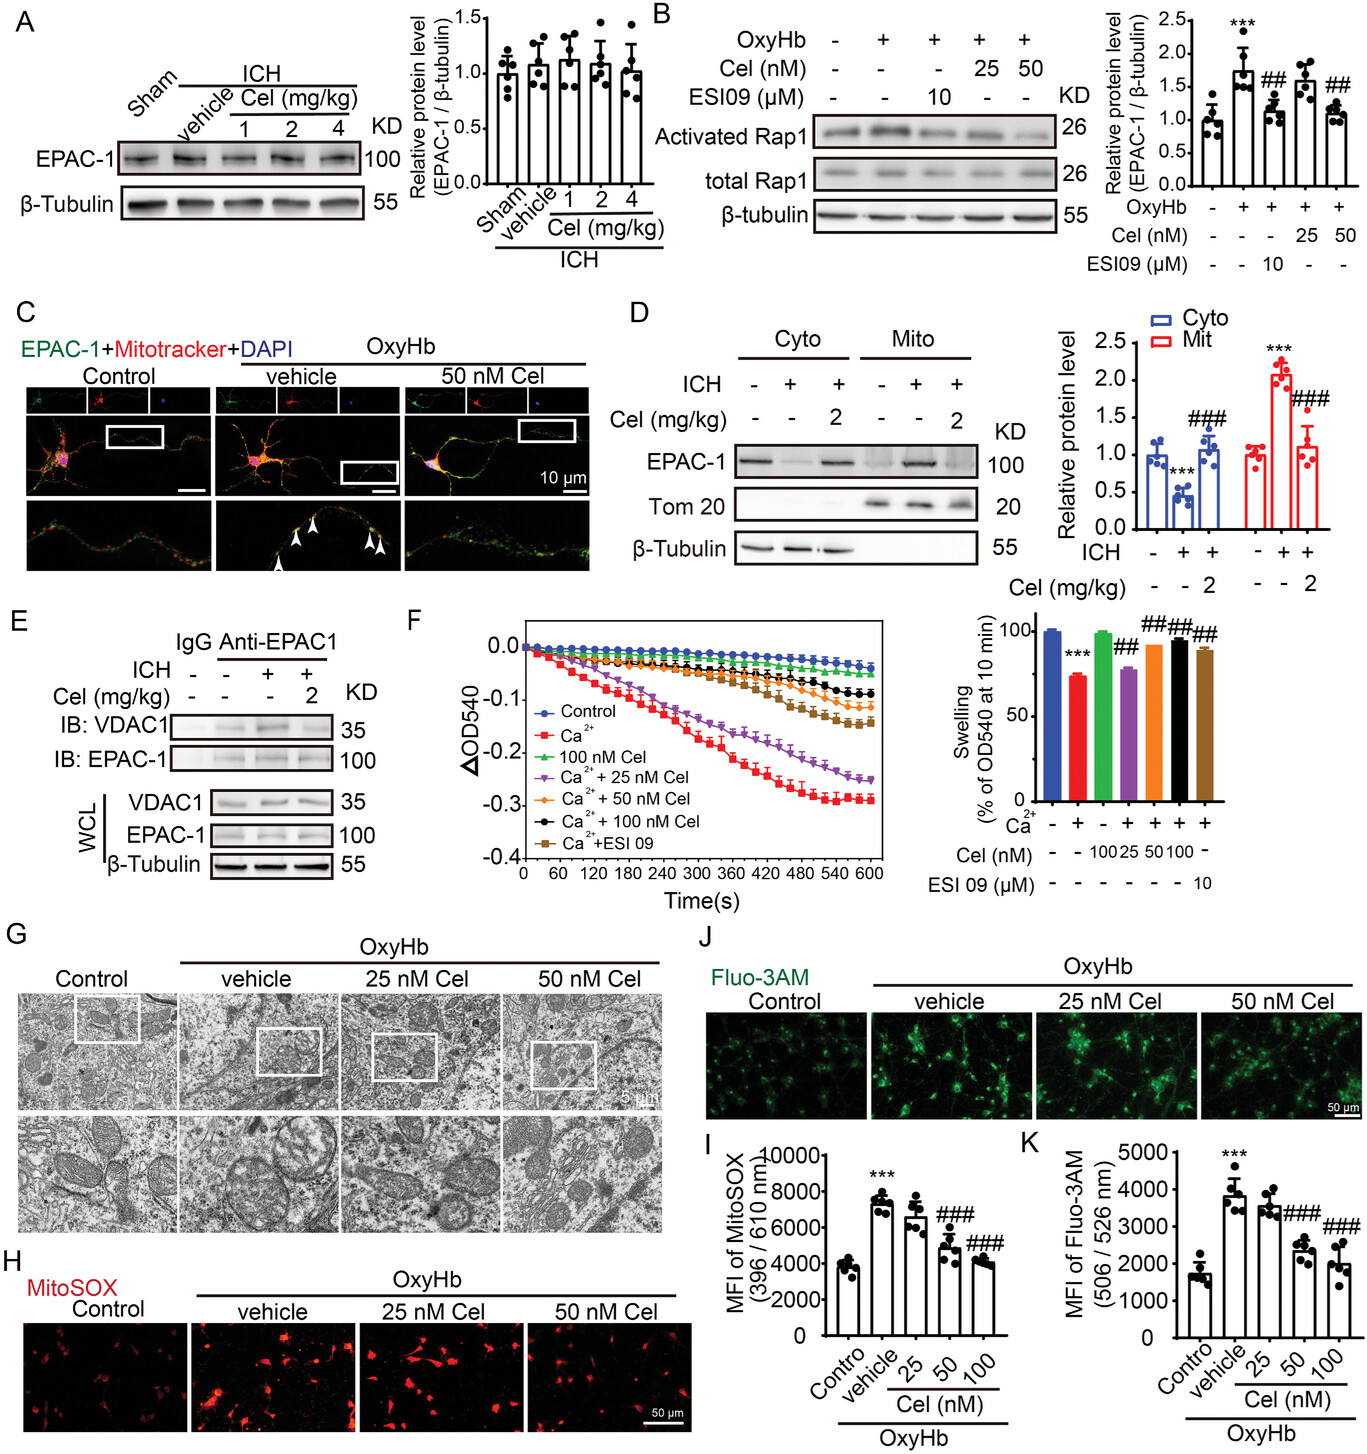
Celastrol inhibits the elevation of EPAC-1 activity and MPTP opening induced by ICH.
A) Samples of cortex surrounding the hematoma in mice were collected 48 h after ICH induction and treatment with 1, 2, and 4 mg k−1g celastrol. EPAC-1 protein levels were detected by western blot. β-Tubulin served as loading controls, with a sham group being normalized to a value of 1 for accurate comparisons, n = 6. B) After being stimulated with OxyHb, the neurons were treated with the EPAC-1 inhibitor ESI09 (10 µm) or celastrol at concentrations of 25 and 50 nm. The activation levels of Rap1-GTP were measured using a Rap1 Activation Assay Kit. β-Tubulin served as loading controls, with each sham group being normalized to a value of 1 for accurate comparisons, n = 6. C) Following stimulation with OxyHb, the neurons were treated with 50 nm celastrol. Immunofluorescence analysis was performed using an anti-EPAC-1 antibody (green) to label neurons and mitotracker staining for mitochondria (red). Nuclei were counterstained with DAPI (blue). Representative images from triplicate experiments are presented, showing co-localization of celastrol and mitochondria in the proximal neurite, as indicated by arrows. Scale bar: 10 µm. D) The protein levels of EPAC-1 in the mitochondria and cytoplasm were evaluated by western blot analysis across different groups. The mean value of each protein in the control group was normalized to 1.0, with β-tubulin and Tom 20 serving as the loading control, n = 6. E) Co-immunoprecipitation was used to detect the interaction between EPAC-1 and VDAC-1. F) Mitochondria were pretreated with celastrol or ESI09 for 30 min, followed by exposure to Ca2+ for another 10 min. Mitochondria swelling traces were recorded based on the absorbance at 540 nm. The mitochondrial swelling was quantified, n = 6. The neurons were stimulated with 10 µm OxyHb for 12 h and subsequently exposed to varying doses of celastrol treatment for 24 h. Afterward, the cells were collected for assessment of mitochondrial function. G) Mitochondrial structures in neurons, with or without celastrol treatment following OxyHb stimulation, were observed using transmission electron microscopy. The scale bar was set at 5 µm. H) Neurons from various experimental groups were subjected to MitoSOX staining and subsequently visualized under a Nikon fluorescence microscope. I) Neurons from various experimental groups were subjected to MitoSOX staining, and the fluorescence intensity was quantified using a fluorescent microplate reader with excitation/emission wavelengths of 396/610 nm, n = 6. J) The Fluo3-AM staining was used to detect calcium in the cytoplasm of neurons, which was subsequently visualized using a Nikon fluorescence microscope. K) The fluorescence intensity of Fluo3-AM was measured using a fluorescent microplate reader with excitation and emission wavelengths set at 506 and 526 nm, respectively, n = 6. All data are presented as mean ± SD. Statistical significance was determined using one-or two-way ANOVA with Tukey’s multiple comparisons tests (*p < 0.05, **p < 0.001, ***p < 0.0001 vs control group; #p < 0.05, ##p < 0.001, ###p < 0.0001 vs vehicle group).
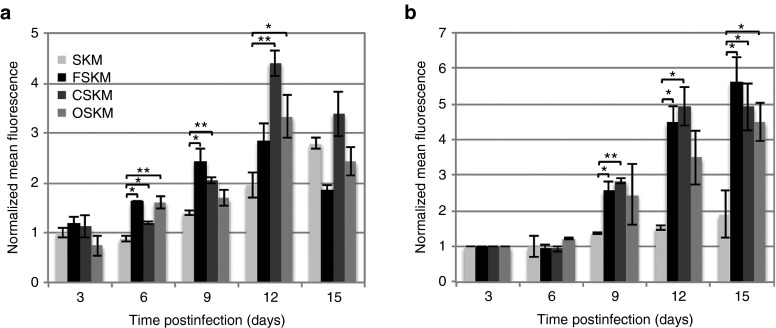
RAP1 activation during reprogramming.
Cells were reprogrammed as described earlier. Four different reprogramming cocktails were used: OSKM, SKM, SKM with forskolin (FSKM), and SKM with 8-pCPT-2′-O-Me-cAMP (CSKM). After passage, small molecules and media supplemented with 0.1% DMSO were replenished every other day. On days 3, 6, 9, 12, and 15 postinfection, cells were fixed using 4% paraformaldehyde and stained using primary antibodies against activated RAP1 (Neweast Biosciences, King of Prussia, PA, 26912) or NANOG (Abcam, ab70482), with secondary antibodies against mouse (Invitrogen, A-11003) and against rabbit IgG (Invitrogen, A-11012).
RAP1 and NANOG are activated during reprogramming.
Mean fluorescence intensity of antibody-stained (a) activated RAP1 and (b) NANOG is shown 3, 6, 9, 12, and 15 days postinfection in SKM, FSKM, CSKM, and OSKM reprogramming conditions and normalized to the SKM day 3 condition. Normalized mean fluorescence intensities ± propagated SDs (n = 3) from positively stained colonies were calculated in ImageJ. Statistical significance with respect to the SKM condition for each day was measured using a Student’s t-test (two-tailed, homoscedastic) with *P< 0.05 and **P < 0.005.