


Published Pictures for 26915 Ran-GTP mAb
Immunoprecipitations, pull‐downs and nuclear transfers
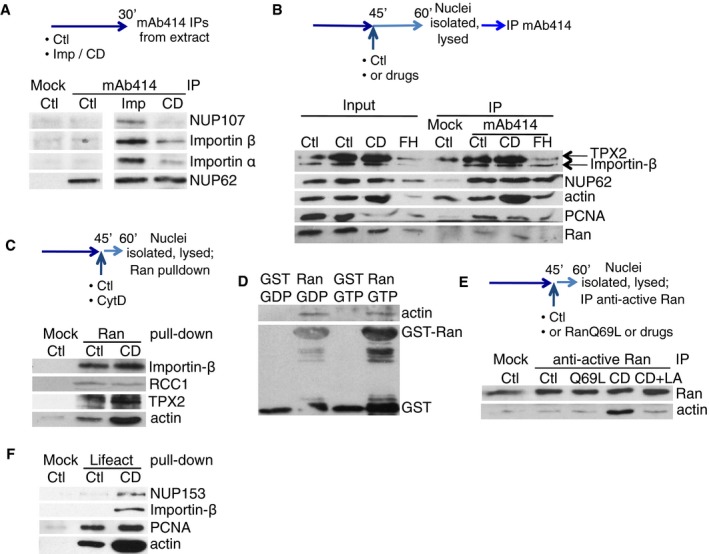
For anti‐active Ran IP, 10 μl packed protein G‐agarose (Roche) beads were incubated with 1 μg of antibody for 2 h at 4°C, blocked in 10 mg/ml BSA/PBS, washed in PBS and incubated with lysed nuclei (corresponding to 25 μl of extract) for 2 h at 4°C, washed in 0.1% Triton X‐100/150 mM NaCl/PBS, resuspended in Laemmli buffer and analysed by Western blotting. For actin‐Ran in vitro pull‐down, glutathione‐Sepharose (GE Healthcare) beads were pre‐incubated with recombinant GST protein (Bompard et al, 2010); 10 μl of glutathione‐GST and glutathione‐GST‐Ran beads were washed and blocked in 10 mg/ml BSA/PBS, washed in PBS and incubated with 1 μg of actin–biotin (Cytoskeleton) for 2 h at 4°C, then proceeded as above. For Lifeact‐NLS‐actin pull‐down, 10 μl packed streptavidin–agarose (Novagen) beads were incubated with 5 nmol Lifeact‐NLS‐biotin peptide (MG‐VADLIKKFESISKEEGDPP‐VATPPKKKRK‐V‐biotin; synthesised by Cambridge Research Biochemicals) for 2 h at 4°C, washed in PBS and incubated with lysed sonicated nuclei (corresponding to 40 μl of extract) for 2 h at 4°C, washed in 150 mM NaCl/PBS, resuspended in Laemmli buffer and analysed by Western blotting.
- In vitro pull‐down between actin–biotin and glutathione‐immobilised GST or GST‐Ran WT, pre‐loaded with either GTP or GDP; beads were blotted for actin or GST.
- Scheme: Nuclei, formed in control extract, supplemented at 45 min with RanQ69L, CytD (CD), without or with latrunculin A (LA), were lysed and immunoprecipitated with anti‐active Ran antibodies (Mock IP, no antibody added). Beads were blotted for actin and Ran.
Ultra-performance liquid chromatography
Purified Ran was incubated with a 10-fold excess of GDP or GTPγS and 10 mM MgCl2 at 4°C overnight with subsequent purification from the unbound nucleotide by gel filtration (buffer composed of 50 mM NaH2PO4, 200 mM NaCl, 5 mM MgCl2, pH8.0). To validate the nucleotide bound to Ran, the nucleotide-bound Ran-GTP and Ran-GDP collected from gel filtration were then heated at 100°C for 10 min, subsequently cooled on ice, and centrifuged at 14000× g for 10 min to denature protein and to release the Ran-bound nucleotide to supernatants. Then the analysis was performed on a C18 reversed phase column using 93% buffer A [100 mM KH2PO4, 10 mM tetra-n-butylammonium tribromide (TBAB) at pH6.5] and 7% buffer B (10% methanol) with GDP/GTPγS as a control.
To study the Ran-bound nucleotide release role of Mog1, Ran-GTP or Ran-GDP was mixed with Mog1 at a 1:1 molar ratio followed by gel filtration to obtain the complex. To validate the nucleotide bound to the complex, the complex sample was analyzed as described above using UPLC.
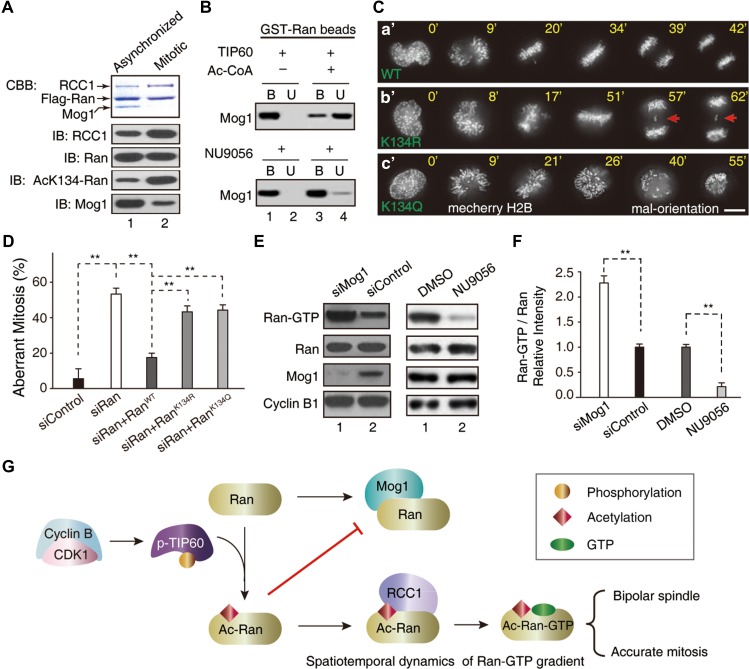
Acetylation of Ran by TIP60 switches Ran from Mog1-binding to RCC1-binding.
(A) Flag-Ran immunoprecipitates from mitotic and asynchronized HeLa cells were analyzed by western blot with indicated antibodies. (B) Purified GST-Ran was incubated with TIP60 in the presence or absence of Ac-CoA or TIP60 inhibitor (NU9056) followed by addition of Mog1. The binding between Ran and Mog1 was analyzed by western blot. (C) Real-time imaging shows that expression of non-acetylatable RanK134R resulted in chromosome segregation error (b’, arrows). Scale bar, 10 μm. (D) Statistical analyses of efficiency of exogenously expressed siRNA-resistant RanWT, RanK134Q, and RanK134R in rescuing the mitotic defects in Ran-suppressed cells (mean ± SEM, n = 16, siControl; n = 13, siRan; n = 18, siRan + RanWT; n = 18, siRan + RanK134R; n = 16, siRan + RanK134Q, **P < 0.01). (E and F) Suppression of Mog1 promoted the level of Ran-GTP and inhibition of TIP60 reduced the level of Ran-GTP in mitosis. Western blotting analyses of Ran-GTP levels in Mog1 suppressed and TIP60-inhibited HeLa cells in mitosis, respectively (**P < 0.01). (G) Working model accounting for acetylation-elicited tuning Ran effector binding for chromosome segregation.
Immunoblotting and immunoprecipitation
Immunofluorescence
The immunofluorescence analysis of the RAN-GTP conformation was performed as follows. SI113-treated and control HUH7 cells as well as SGK1 and EGFP HUH7 cells grown on coverslips were washed with 1X PBS and permeabilized in 1% Triton-X100 PHEM (45 mM HEPES pH 6.9, 45 mM PIPES pH 6.9, 10 mM EGTA, 5 mM MgCl2, 1 mM PMSF) for 1 minute at room temperature. After an additional wash with 1X PBS, the cells were incubated with a conformational monoclonal Active-RAN antibody (26915, NewEastBioscences) diluted 1:50 in PBS/0.1% Tween containing 3% BSA for 2 h at room temperature. The cells were then fixed with 3.7% formaldehyde and 30 mM sucrose for 10 minutes, washed twice with 1X PBS, post-fixed with ice-cold methanol and re-washed twice with 1X PBS. The prepared samples were incubated with TRITC-conjugated goat anti-mouse Ig (A11004, Molecular Probes diluted 1:250) to detect Active-RAN in dilution buffer containing 3% BSA for 30 minutes and, finally, incubated with 4′,6-diamidino-2-phenylindole (0.05% μg/ml) for 1 minute at room temperature to stain DNA. The samples were washed three times with PBS/Tween 0.1% before images acquisition. Samples were visualized under a Leica TC SP2 microscope (Leica, Wetzlar, Germany) with a x63 objective and processed with Leica confocal software. The digital zoom is indicated by the scale bar. Immunofluorescence analyses of RANBP1 and RANGAP1 were performed as follows. HUH7 EGFP cells, HUH7 cells treated with SI113 or DMSO for 24 h and HUH7 cells overexpressing SGK1 were grown on coverslips in 6-well culture dishes in Dulbecco’s Modified Eagle’s Medium (Invitrogen). The cells were subsequently fixed in 3.7% formaldehyde for 20 minutes, permeabilized in 0.5% Triton X-100 for 5 minutes and washed with phosphate-buffered saline (PBS) (pH 7.4). Next, the samples were incubated with a goat polyclonal antibody for total RAN (Santa Cruz sc-1156, 1:250 dilution), a goat RANBP1 antibody (sc-1160, Santa Cruz, 1:250 dilution) and a mouse RANGAP1 antibody (sc-28322, Santa Cruz, 1:250 dilution) for 2 h at room temperature in PBS (pH 7.4) containing bovine serum albumin (1 mg/ml) and Tween-20 (0.2%). The cells were then washed in PBS 1X and incubated with FITC-conjugated donkey anti-goat Ig (sc-2024, Santa Cruz) to detect RAN, TRITC-conjugated donkey anti-goat Ig (705-586-147, Jackson Immunoresearch) to detect RANBP1 and a TRITC-conjugated goat anti-mouse antibody (molecular probes A11004) to detect RANGAP1, in the presence of 4′,6-diamidino-2-phenylindole (0.05% μg/ml). The samples were finally visualized under a Leica TC SP2 microscope (Leica, Wetzlar, Germany) with a x63 objective and processed with Leica confocal software. The digital zoom is indicated by the scale bar.
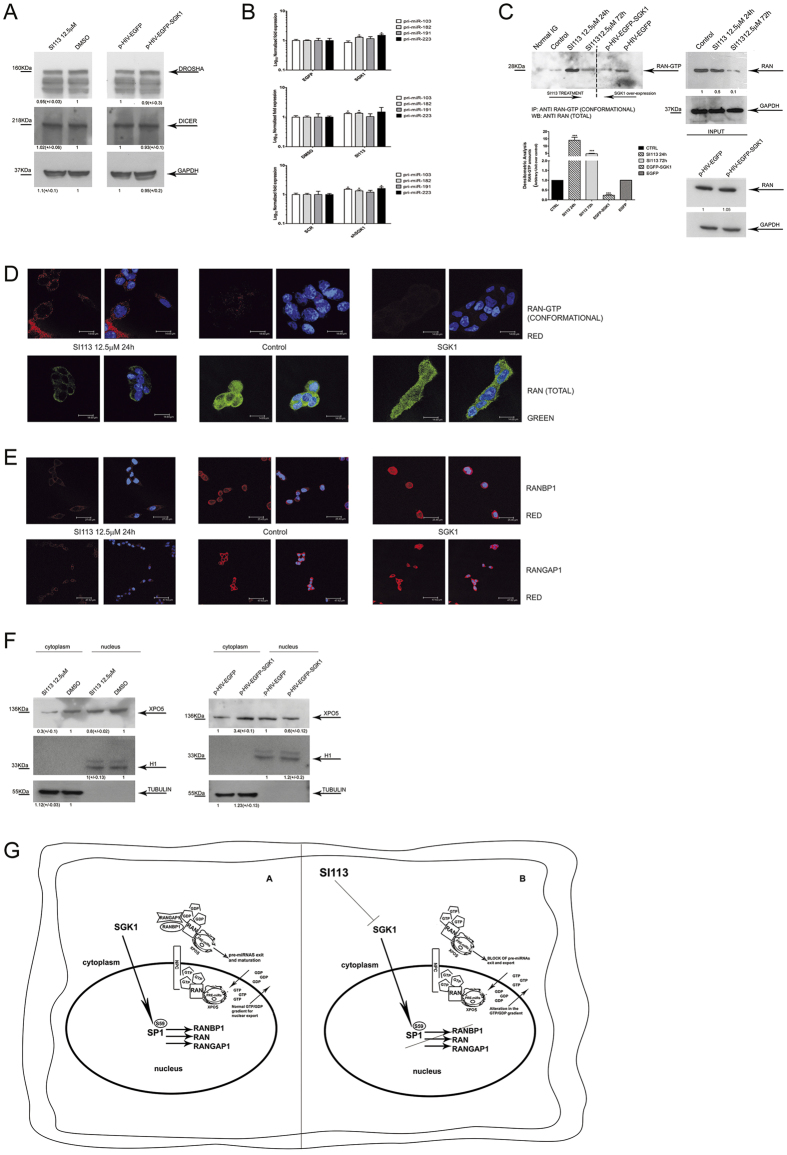
SGK1 fluctuations disrupt the equilibrium of the RAN/RANBP1/RANGAP1 axis, affecting the GTP gradient and nuclear transport.
(A) Western blot of proteins from HUH7 cells, treated with SI113 (12.5 μM; 72 h) or vehicle (left), or transduced with EGFP-SGK1 or EGFP (right). Cell extracts were separated, blotted and decorated by DROSHA, DICER and GAPDH antibodies. (B) Quantitative RT-PCR analysis of pri-microRNAs in HUH7 cells stably over-expressing EGFP-SGK1 or EGFP (upper panel), in SI113-treated HUH7 and control cells (middle panel), in shSGK1 and shScrl HUH7 cells (bottom panel). The assay was performed as above. Results are represented as Log10 of fold expression ± SD and evaluated using t-test. (C) Immunoprecipitation of RAN-GTP from HUH7 cells treated with SI113 (12.5 μM; 24 h and 72 h) or vehicle or transduced with a lentivirus encoding p-HIV-EGFP or p-HIV-EGFP-SGK1. Immunoprecipitation was performed as described in methods. The immunoprecipitates (left) and the corresponding total extracts (right) were blotted and decorated by anti-Ran total goat polyclonal antibodies. GAPDH was used as a loading control (right). (D) Representative immunofluorescence analysis of HUH7 cells either treated with SI113 (12.5 μM) or over-expressing SGK1 (pcDNA4-TO-SGK1) compared with control cells. Samples were incubated with either a conformational Active-RAN monoclonal antibody or with an anti-Ran total goat polyclonal antibody and DAPI (0.05% μg/ml1). Since no variation in fluorescence was observed between the different experimental controls; only one control is presented in the panel. (Leica TC SP2 microscope with a x63 objective and Leica confocal software). (E) HUH7 cells treated as above, were stained with either an anti-RANBP1 goat polyclonal antibody or an anti-RANGAP1 monoclonal antibody and DAPI (0.05% μg/ml).
Pulldown and Western blot
Ran(GTP) was identified in cell lysates by pulldown experiments using reagents from New East Biosciences. To this end, RAW264.7 macrophages in T75 tissue culture flasks were infected (MOI 20, 1 h), lysed with lysis buffer (50 mM Tris-HCl, pH 8.0, 130 mM NaCl, 10 mM MgCl2, 1 mM EDTA, 1% Triton X-100) containing a protease inhibitor tablet (complete; Roche) and incubated with an anti-Ran(GTP) antibody (1∶2000, New East Biosciences) together with protein A/G-agarose beads for 2 h. The beads were then washed 4 times with lysis buffer, subjected to SDS-PAGE and analyzed by Western blot using an anti-Ran antibody (1∶1000, Abcam). As positive and negative controls, uninfected cells were treated with γ-S-GTP or GDP in presence of 20 mM EDTA before incubation with the anti-Ran(GTP) antibody. Alternatively, A549 cells were washed three times with cold PBS before lysis, incubated for 30 min at 30°C with γ-S-GTP (100 µM) or GDP (1 mM), together with purified His6-LegG1, heat-inactivated His6-LegG1, LegG-His6, LegG1_N223A-His6, or human RCC1, and Ran(GTP) was immuno-precipitated as described above.
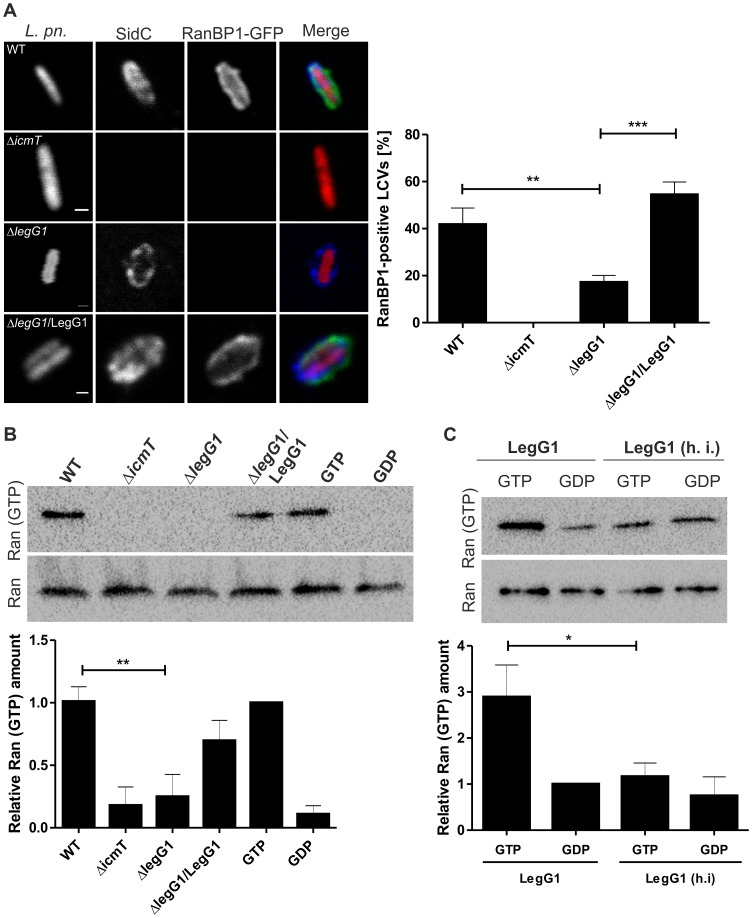
L. pneumophila wild-type but not ΔlegG1 activates Ran on LCVs.
(A) …(B) Production of Ran(GTP) in infected macrophages. RAW264.7 macrophages were infected (MOI 25, 1 h) with L. pneumophila wild-type, ΔicmT or ΔlegG1 harboring pCR033 (vector) or with ΔlegG1/pSU19 (M45-LegG1). The infected macrophages were lysed, activated Ran was immuno-precipitated with an antibody specifically recognizing Ran(GTP) and visualized by Western blot using an anti-Ran antibody. Lysates of uninfected cells incubated with GTP or GDP in presence of EDTA were used as positive or negative controls for endogenous GEF activity. Loading control: Western blot of Ran in samples before immuno-precipitation. (C) Production of Ran(GTP) in cell lysates. A549 epithelial cells were lysed and incubated with purified His6-LegG1 (native or heat-inactivated, h. i.) in presence of excess GTP (100 µM) or GDP (1 mM). Activated Ran was immuno-precipitated with an antibody specifically recognizing Ran(GTP) and visualized by Western blot using an anti-Ran antibody. Loading control: Western blot of Ran in samples before immuno-precipitation. The relative amount of Ran(GTP) was determined by densitometry; means and standard deviations of 4 (B, C) independent experiments are shown (*, p<0.05; **, p<0.01).
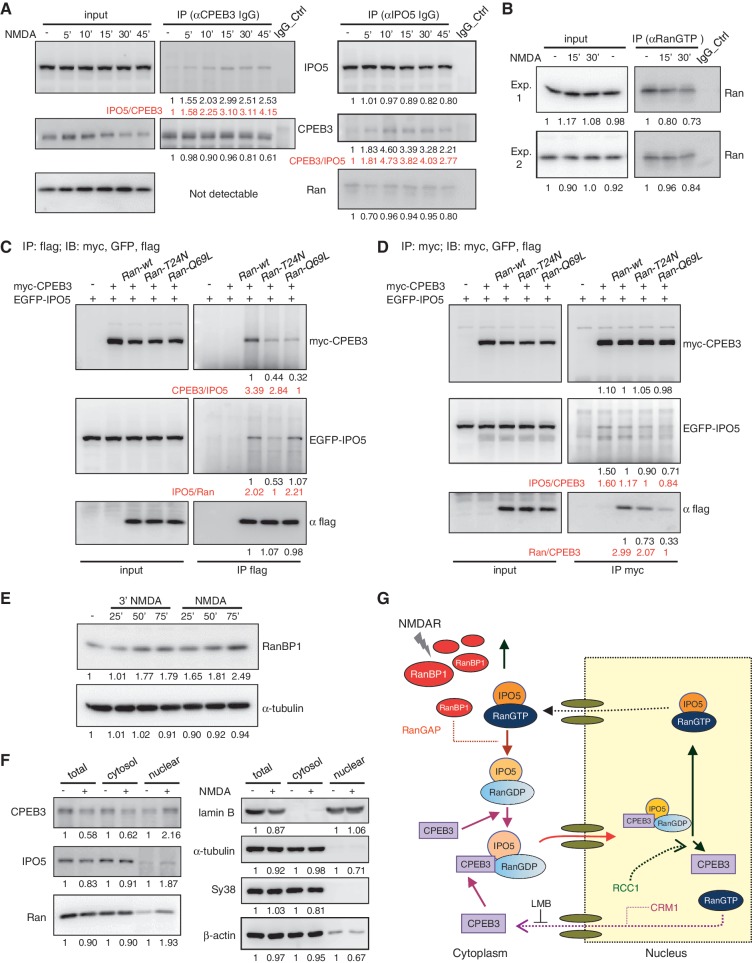
NMDAR signaling enhances CPEB3–IPO5 interaction through Ran-related changes.
(A) Neurons stimulated with 3 min of NMDA and then incubated for the denoted time were used for IP with CPEB3 and IPO5 IgGs, followed by immunodetection with IPO5, CPEB3 and Ran antibodies. The intensities of immunodetected signals analysed by the ImageJ software are displayed as relative ratios at the bottoms of blots. The ratios of the co-precipitated target versus the immunoprecipitated protein (IPO5/CPEB3 or CPEB3/IPO5) are shown in red. (B) The cytoplasmic fraction isolated from neurons treated with ± NMDA was precipitated with the RanGTP antibody and immunoblotted with Ran antibody. (C and D) HeLa cells expressing myc-CPEB3, EGFP-IPO5 along with Ran-wt, T24N or Q69L mutant were pulled down with (C) flag or (D) myc antibodies. The precipitated substances were probed with GFP, myc and flag antibodies. (E) Neurons stimulated with a pulse of NMDA or NMDA for the indicated times were harvested for western blotting using RanBP1 and tubulin antibodies. (F) The nuclear and cytosol lysates fractionated from neurons treated with ± NMDA for 30 min were used for immunoblotting. (G) Schematic model of NMDA-induced nuclear import of CPEB3. NMDAR signaling increases RanBP1 expression, combined with RanGAP to stimulate Ran’s GTPase activity. Consequently, the IPO5-RanGDP complex can bind to CPEB3 and deliver CPEB3 to the nucleus. After nuclear import, a high RanGTP concentration and RCC1 in the nucleus triggers the release of CPEB3 from the ternary complex because RanGTP impairs the interaction between IPO5 and CPEB3. The nuclear export of CPEB3 is mediated by CRM1.
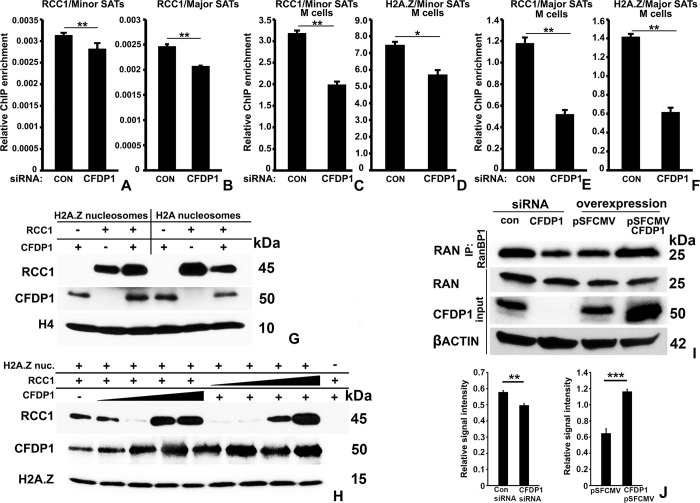
CFDP1 regulates RCC1 binding to minor and major satellite repeats.
(I) RAN activation assay for measurement of RAN activity in mitotic cells subjected to CFDP1 siRNA or CFDP1 overexpression. Levels of RAN-GTP bound to RANBP1 agarose beads were assayed by immunoblot analysis. (J) Quantification of relative levels of RanGTP signal intensity from control and CFDP1 siRNA-treated cells in immunoblots from 7I. RanGTP signal in IP fraction was normalized with the corresponding signal intensity of total Ran levels in input fraction. Molecular weights of detected proteins are indicated next to immunoblots. IP, immunoprecipitation. p (* < 0.05, ** < 0.01, *** < 0.001). CFDP1, craniofacial development protein 1; ChIP, chromatin immunoprecipitation.
Immunofluorescence microscopy
For immunofluorescence studies using 6XHIS, CFDP1, HP1α, and H3K9me3 antibodies, NIH3T3 cells grown on glass bottom chamber slides (Millicell EZ slide, MilliporeSigma) were fixed with cold (−20°C) ethanol containing 5% (v/v) acetic acid for 10 min and then rehydrated in cold PBS containing 0.5% Triton X-100 for another 5 min. For immunofluorescence experiments with α tubulin and for EdU labeling, cells were fixed with −20°C methanol for 10 min and rehydrated as above. For RanGTP immunofluorescence experiments, cells were fixed with 4% paraformaldehyde for 8 min and permeabilized with 0.5% Triton X100-PBS for 8 min. Blocking was carried out by incubating cells with 1% BSA in PBS followed by incubation with primary antibodies diluted in PBS-0.1%Tween20 for 1 h at room temperature. Alexa-Fluor conjugated secondary antibodies were used for detection and slides mounted with ProLong Diamond antifade reagent containing DAPI (Thermo Fisher Scientific). Cells were imaged with a 40× objective on a confocal laser scanning microscope (Zeiss LSM 780).
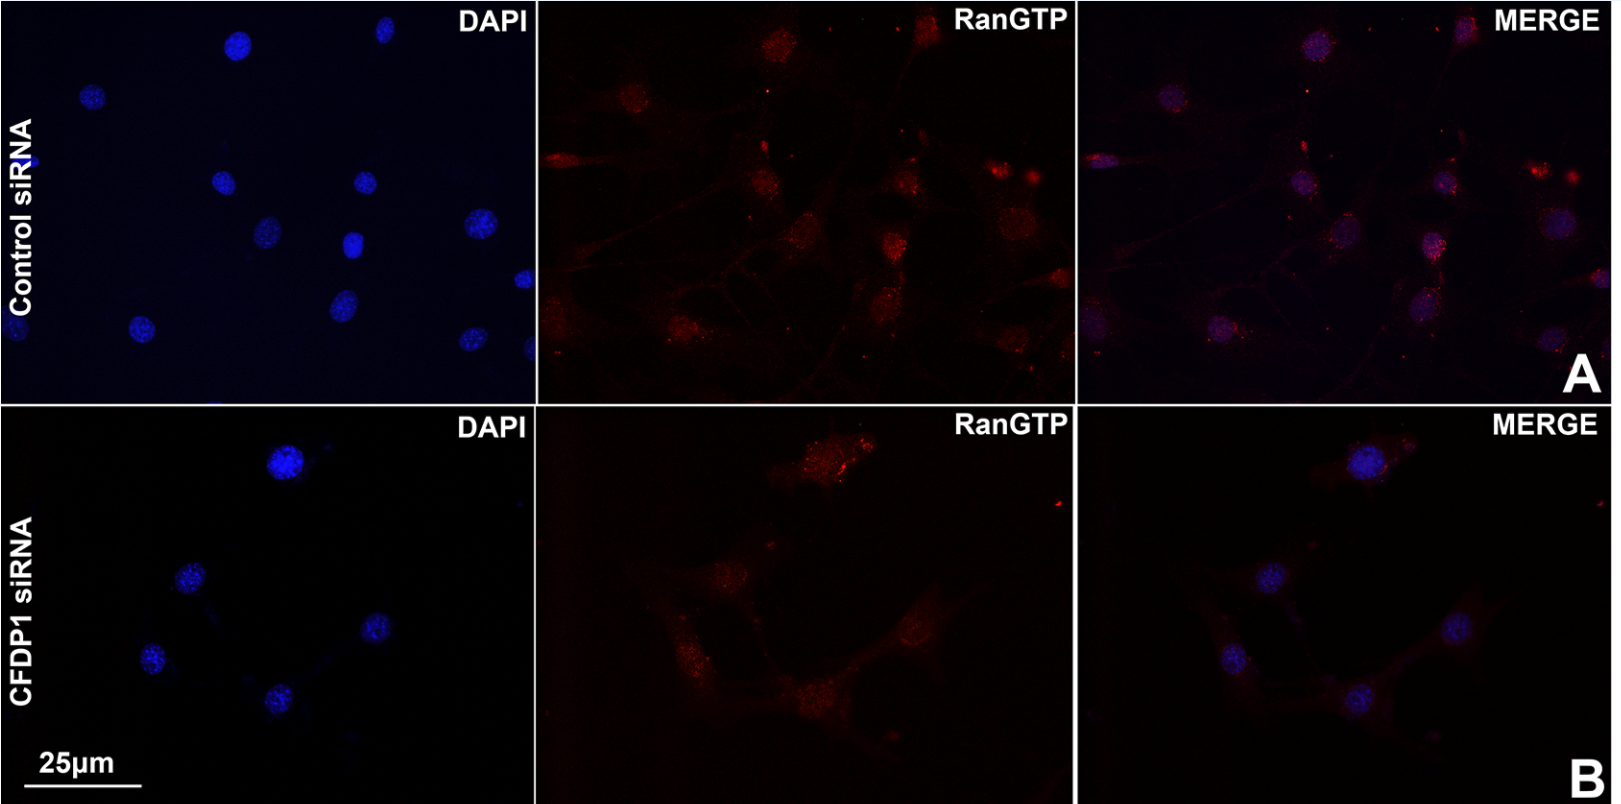
Representative immunofluorescence images comparing RanGTP levels in control and CFDP1 siRNA-treated NIH3T3 cells.
(A) RanGTP was detected using an antibody directed against the active form of Ran after 72 h of siRNA treatment. (B) Quantitation of RanGTP signal intensity in control and CFDP1 siRNA-treated cells. Approximately 200 cells were individually imaged using Image J software for each condition from 3 independent experiments (error bars = ± SEM).
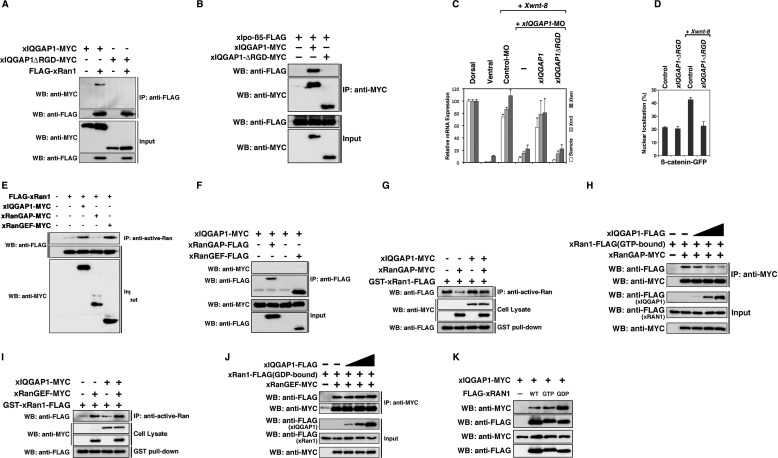
GST Pulldown, GAP, and GEF Assay
GST-xRan1-FLAG was expressed in Escherichia coli BL21 (DE3). Bacteria were lysed with GST lysis buffer (PBS with 1% Triton X-100, 1 mm DTT, and Complete protease inhibitor cocktail (Roche Applied Science)). GST fusion proteins were purified by affinity chromatography with glutathione-Sepharose 4B (GE Healthcare) and eluted with 50 mm Tris-HCl (pH 8.0) and 20 mm glutathione. Purified proteins were mixed in TNE buffer (10 mm Tris-HCl (pH 7.8), 0.1% Nonidet P-40, 150 mm NaCl, 1 mm EDTA, 1 mm DTT, 10% glycerol, and Complete protease inhibitor cocktail (Roche Applied Science)). The protein solutions were added to glutathione-Sepharose 4B (GE Healthcare) and incubated for 2 h at 4 °C. The GAP or GEF activity toward xRan1 was examined by the Western blotting of immunoprecipitates with the anti-active-Ran antibody. Each reaction performed in 50 μl of buffer A (50 mm HEPES, pH 7.4, 1.5 mm magnesium chloride, 5 mm EGTA, 1 mm DTT, 1 mm ATP, and Complete protease inhibitor cocktail (Roche Applied Science)) with the addition of 1 μl of cell lysate. Cell lysates were prepared from HEK 293T cells transfected with xIQGAP1-MYC, xRanGAP-MYC, xRanGEF-MYC, or pCS2+, using buffer B (buffer A + 150 mm sodium chloride, 10% glycerol, 1% Triton X-100, 60 mm magnesium chloride). Reactions were incubated at room temperature for 5 min and terminated by adding 250 μl of buffer B. We performed immunoprecipitation with the same tubes for 30 min. For GAP assays, GST-xRan1-FLAG was preloaded with GTP (1 mm) for 10 min at room temperature. For GEF assays, we added 0.1 mm GTP and 0.1 mm GDP in reactions.
Binding assays
Pull-down assays were performed essentially as described (Agassandian et al., 2005, 2010). For in vitro binding assays of purified recombinant CRM1 and purified CCTα in the presence of RanGTP we first loaded purified, untagged Ran (3 μg) with 1 mM GTP by incubation for 1 h at 21°C in the presence of 5 mM (CH3COO)2Mg. The RanGTP was then incubated with 0.25 μM CRM1 and CCTα-conjugated Talon resin in the presence or absence of LMB or EGTA for 1 h at 21°C. Proteins were then released from resin by boiling for 5 min in Laemmli buffer and analyzed by SDS–PAGE.
Measurement of RAN activity
RAN activity was measured using a RAN activation assay kit according to the manufacturer’s instructions (NewEast Biosciences). Briefly, anti-active RAN mouse mAb was incubated with cell lysates containing RAN-GTP. The bound active RAN was pulled down by Protein A/G–agarose, eluted, and detected by immunoblot analysis using polyclonal rabbit anti-Ran antibody.
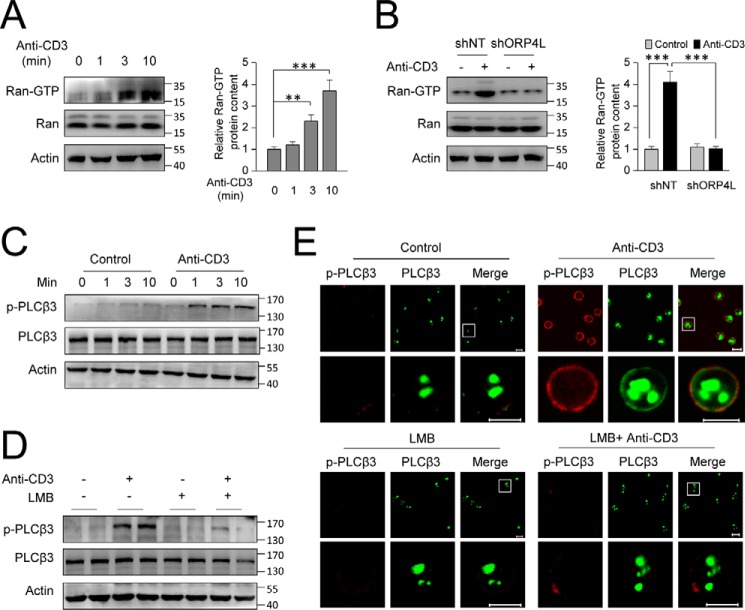
Anti-CD3 stimulation activates RAN for PLCβ3 exportation from the nucleus in Jurkat T-cells.
A, the active form of RAN (RAN-GTP) in Jurkat T-cells upon anti-CD3 stimulation. Cells were stimulated for the indicated times with 10 μg ml−1 anti-CD3. B, the active form of RAN (RAN-GTP) in Jurkat T-cells with ORP4L knockdown upon anti-CD3 stimulation. Cells were stimulated for 3 min with 10 μg ml−1 anti-CD3 for 3 min. The relative GTP-RAN protein content was quantified from Western blots and normalized with the β-actin signal. C and D, Jurkat T-cells were stimulated for the indicated times with 10 μg ml−1 anti-CD3
Binding assays
Pull-down assays were performed essentially as described (Agassandian et al., 2005, 2010). For in vitro binding assays of purified recombinant CRM1 and purified CCTα in the presence of RanGTP we first loaded purified, untagged Ran (3 μg) with 1 mM GTP by incubation for 1 h at 21°C in the presence of 5 mM (CH3COO)2Mg. The RanGTP was then incubated with 0.25 μM CRM1 and CCTα-conjugated Talon resin in the presence or absence of LMB or EGTA for 1 h at 21°C. Proteins were then released from resin by boiling for 5 min in Laemmli buffer and analyzed by SDS–PAGE.
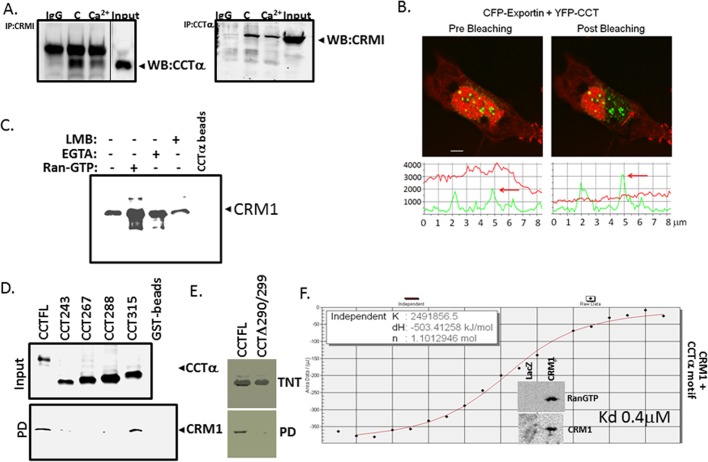
CRM1/exportin 1 binds CCTα.
(C) Direct binding of recombinant CRM1 to purified CCTα. Binding reactions were performed using recombinant CRM1 with purified CCTα-conjugated to Talon resin in the presence or absence of RanGTP, LMB, or EGTA, followed by pull-down assays. The results were visualized by immunoblot analysis. (D, E) Identification of a CRM1-docking site within CCTα. GST-fused CCTα mutants were expressed in MLE cells (D, top). Cell lysates were then processed for GST-pull-down assays, followed by immunoblotting (bottom). (E) CCTα full length and an internal deletion mutant were synthesized using TnT (top), followed by pull-down assays using CRM1-conjugated beads (bottom). The beads were prepared using His-tagged CRM1 protein synthesized by TnT. CCTα full length and mutants bound to CRM1 beads were detected using immunoblotting. The results were visualized by immunoblot analysis (D) or autoradiography (E). (F) ITC binding analysis of CRM1 and a peptide (LEMFGPEGAL) encoding a CaMKI-binding motif within CCTα. The insert demonstrates the enrichment of CRM1 fraction with RanGTP. Data in each panel represent n = 2 or 3 separate experiments. *p < 0.05 vs. control.
Immunoprecipitation (IP) and GST pull-down assays
For immunoprecipitation assays in S2 cells, cDNAs encoding per and tim were cloned into the expression vectors pAc-HA and pIZ/V5-His, respectively. NLS mutants for each construct (pAc-per_mNLS-HA and pIZ-tim_mNLS-V5) were generated by site-directed mutagenesis with the Quick Change mutagenesis kit (Stratagene). The cDNAs of importin α1 lacking the IBB domain (importin α1∆IBB) and wild-type were amplified and tagged with a VSV epitope using PCR and cloned into a pIZ/V5-His vector. Both pIZ-tim PL-V5 and pIZ-tim TA-V5 were generated as previously described [25]. S2 cells were transfected with various combinations as indicated. After 60 h, cells were collected and lysed in lysis buffer (1X CompleteEDTA-free Protease Inhibitor (Roche), 50 mM Tris-HCl pH 7.5, 150 mM NaCl, 1 mM EDTA, 0.5% Triton X-100). Extracts were incubated with anti-V5 or anti-VSV antibodies at 4°C for 4 h and followed by 2 h-incubation with Protein G or A Dynabeads (Invitrogen). After washing, bound proteins were eluted and subjected to western blot analysis with the following antibodies: rabbit anti-NUP153 antibody (a gift from Dr. M. Capelson [54], 1:1000), mouse anti-V5 (Invitrogen, 1:1000), anti-HA (Sigma, 1:1000) and anti-VSV (Sigma, 1:1000). To perform the immunoprecipitation from fly head extracts, fly heads were homogenized in EB1 lysis buffer. Extracts were incubated overnight with anti-HA beads (sigma) at 4°C and washed three times with lysis buffer. Proteins were eluted and subjected to western blot analysis. For the GST pull-down assay, the FG repeat of Nup153 or Ran (for GDP-bound) or Ran Q69L (for GTP-bound) was cloned into a pGEX-4T-1 vector (GE Healthcare). These GST-fusion proteins were expressed in E. coli and purified using glutathione-Sepharose 4B beads (GE Healthcare). GST-Ran proteins were loaded with GDP or GTP γS using the Ran activation assay kit from New East Biosciences. GST alone (control) or GST-fusion proteins on beads were incubated with TIM-V5 expressed in S2 cells for 4 h at 4°C. After washing, bound TIM-V5 was detected by using a mouse anti-V5 antibody (Invitrogen).
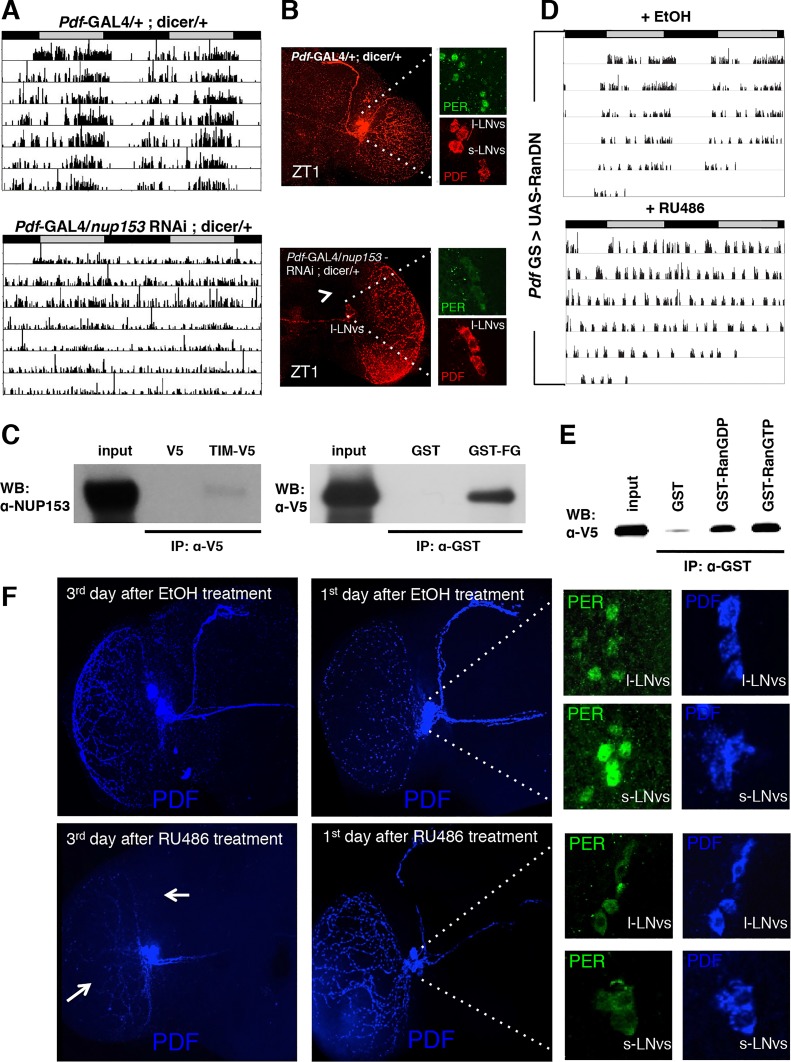
NUP153 and RAN are required for circadian rhythms and interact with TIM.
(D) Expression of a dominant negative form of Ran (RanDN) in PDF+ cells during adulthoods leads to arrhythmia in DD. RanDN was expressed under control of an RU486-inducible Pdf-GS driver. Flies were fed either 500 mM RU486 or ethanol (EtOH, vehicle control) from the time of entrainment. (E) GST pulldown experiments detect interactions between TIM expressed in S2 cells and purified GST-RAN fusion proteins. RAN was tested in GDP-bound (RanGDP) and GTP-bound (RanGTP) forms. GST alone served as a control. The bound protein was analyzed with an anti-V5 antibody. In five independent experiments we have confirmed that TIM shows slight preference (1.64 ± 0.18) for Ran GTP over Ran GDP. (F) Expression of RanDN in central clock cells leads to severe morphological defects (white arrow) on the 3rd day after RU486 treatment. On the 1st day after RU486 treatment, morphological effects were not visible and PER (green) was cytoplasmic in both l-LNvs and s-LNvs at ZT1.
Immunofluorescence
The immunofluorescence analysis of the RAN-GTP conformation was performed as follows. SI113-treated and control HUH7 cells as well as SGK1 and EGFP HUH7 cells grown on coverslips were washed with 1X PBS and permeabilized in 1% Triton-X100 PHEM (45 mM HEPES pH 6.9, 45 mM PIPES pH 6.9, 10 mM EGTA, 5 mM MgCl2, 1 mM PMSF) for 1 minute at room temperature. After an additional wash with 1X PBS, the cells were incubated with a conformational monoclonal Active-RAN antibody (26915, NewEastBioscences) diluted 1:50 in PBS/0.1% Tween containing 3% BSA for 2 h at room temperature. The cells were then fixed with 3.7% formaldehyde and 30 mM sucrose for 10 minutes, washed twice with 1X PBS, post-fixed with ice-cold methanol and re-washed twice with 1X PBS. The prepared samples were incubated with TRITC-conjugated goat anti-mouse Ig (A11004, Molecular Probes diluted 1:250) to detect Active-RAN in dilution buffer containing 3% BSA for 30 minutes and, finally, incubated with 4′,6-diamidino-2-phenylindole (0.05% μg/ml) for 1 minute at room temperature to stain DNA. The samples were washed three times with PBS/Tween 0.1% before images acquisition. Samples were visualized under a Leica TC SP2 microscope (Leica, Wetzlar, Germany) with a x63 objective and processed with Leica confocal software. The digital zoom is indicated by the scale bar. Immunofluorescence analyses of RANBP1 and RANGAP1 were performed as follows. HUH7 EGFP cells, HUH7 cells treated with SI113 or DMSO for 24 h and HUH7 cells overexpressing SGK1 were grown on coverslips in 6-well culture dishes in Dulbecco’s Modified Eagle’s Medium (Invitrogen). The cells were subsequently fixed in 3.7% formaldehyde for 20 minutes, permeabilized in 0.5% Triton X-100 for 5 minutes and washed with phosphate-buffered saline (PBS) (pH 7.4). Next, the samples were incubated with a goat polyclonal antibody for total RAN (Santa Cruz sc-1156, 1:250 dilution), a goat RANBP1 antibody (sc-1160, Santa Cruz, 1:250 dilution) and a mouse RANGAP1 antibody (sc-28322, Santa Cruz, 1:250 dilution) for 2 h at room temperature in PBS (pH 7.4) containing bovine serum albumin (1 mg/ml) and Tween-20 (0.2%). The cells were then washed in PBS 1X and incubated with FITC-conjugated donkey anti-goat Ig (sc-2024, Santa Cruz) to detect RAN, TRITC-conjugated donkey anti-goat Ig (705-586-147, Jackson Immunoresearch) to detect RANBP1 and a TRITC-conjugated goat anti-mouse antibody (molecular probes A11004) to detect RANGAP1, in the presence of 4′,6-diamidino-2-phenylindole (0.05% μg/ml). The samples were finally visualized under a Leica TC SP2 microscope (Leica, Wetzlar, Germany) with a x63 objective and processed with Leica confocal software. The digital zoom is indicated by the scale bar.
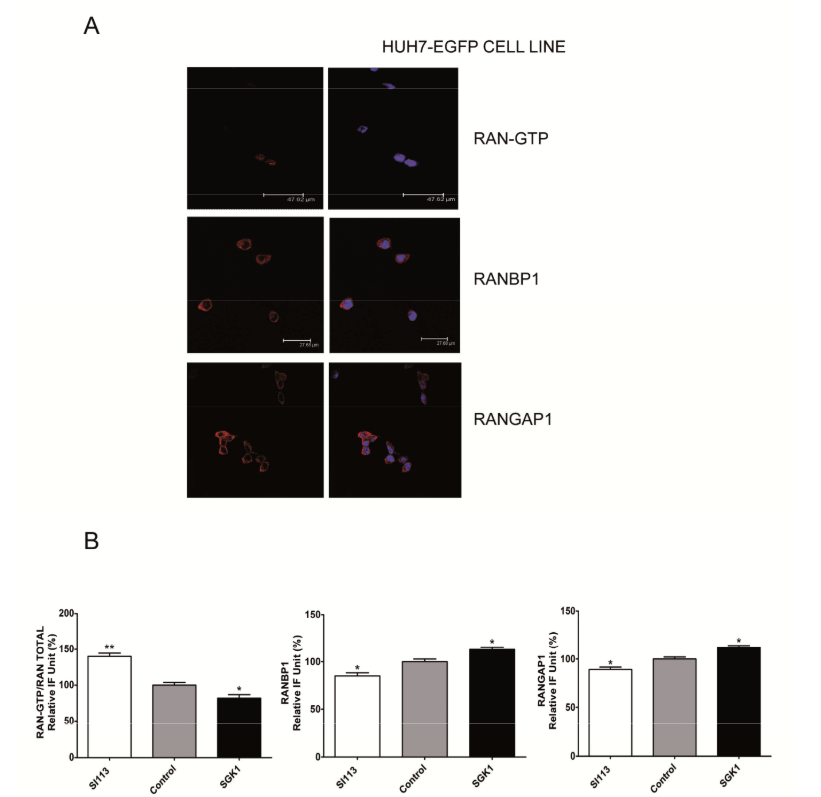
Representative immunofluorescence analysis of HUH-EGFP cells (top panel), no
differences was recordable with the scrambled control cells, reported in Fig 6d and e. Samples were
incubated with a conformational Active-RAN monoclonal antibody, or with an anti-RANBP1 goat
polyclonal antibody or an anti-RANGAP1 monoclonal antibody and 4’,6-diamidino-2-phenylindole
(0.05% µg/ml). Histograms representing the quantification of immunofluorescence showed in Fig.
6d and 6e (bottom panel). The values are plotted as relative IF unit expressed as percentage of
RAN-GTP/RAN total ratio (left), RANBP1 (middle) and RANGAP1 (right).