

Published Pictures for 26918 Arf6-GTP mAb
Immunostaining and observation of neutrophils
Neutrophils were fixed with 4% paraformaldehyde for 10 min and permeabilized with 0.01% saponin for 5 min and blocked with 2% BSA in PBS for 1 h. Cells were then incubated with 1:100 diluted primary Abs in blocking buffer at 4°C overnight, followed by incubation of fluorescence conjugated secondary Abs (Alexa 488 colored in green and Alexa 633 colored in red in the figures) with 1:200 dilution for 1 h at room temperature. Slides were prepared with the mounting medium containing DAPI and imaged under a Leica SP5 confocal microscopy.
Quantification of polarization of immunostained proteins in neutrophils was done as previously described (16). Briefly, if the fluorescence intensity in 25% of the cell periphery is accounted for more than 50% of the total fluorescence intensity of the cell periphery, we call the cell polarized.
For colocalization quantification, Z stack images of consecutive optical planes spaced by 0.2 μm were acquired to cover the whole-cell volume using confocal microscopy. Pearson coefficient was determined using Imaris 7.2.3. The three-dimensional (3D) images were reconstructed using Imaris 7.2.3 with a surface rendering model and further adjusted with ImageJ (v1.48K).
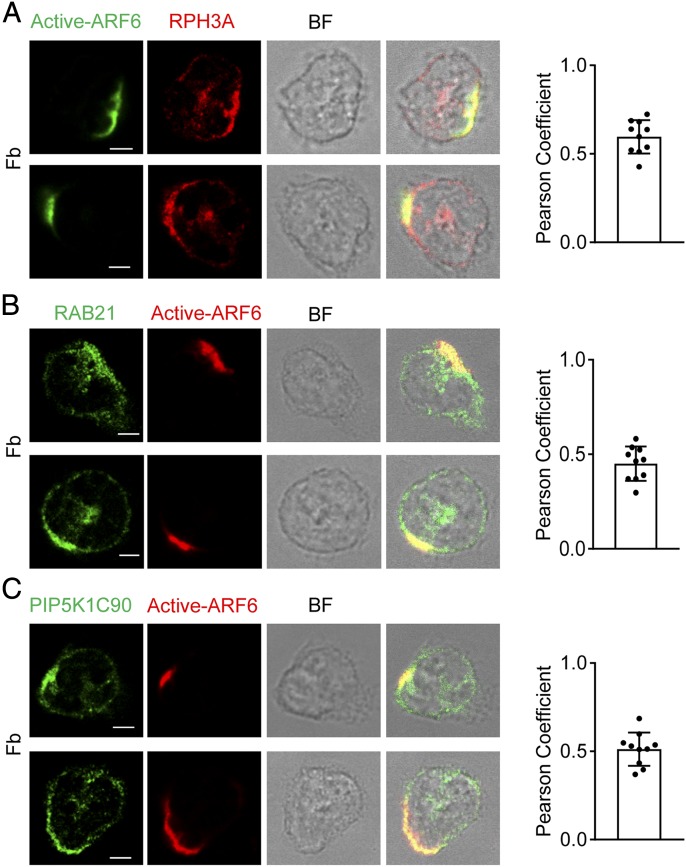
ARF6 is copolarized with RPH3A, RAB21, and PIP5K1C90 in Fb-stimulated neutrophils.
(A–C) Copolarization of active ARF6 with RPH3A (A), RAB21 (B), and PIP5K1C90 (C) in neutrophils. Neutrophils attached to Fb-coated surfaces were stained with anti-active ARF6 and anti-RPH3A (A), anti-RAB21 (B), or anti-PIP5K1C90 (C), followed with Alexa 488 (green)– and Alexa 633 (red)–conjugated secondary Abs, respectively. Representative optical section images of two cells are shown. The quantification of colocalization is presented as Pearson correlation coefficient (Pearson Coefficient). Each data point represents a cell. The experiments were repeated three times. Scale bar, 3 μm. BF, bright field.
Immunostaining and observation of neutrophils
Neutrophils were fixed with 4% paraformaldehyde for 10 min and permeabilized with 0.01% saponin for 5 min and blocked with 2% BSA in PBS for 1 h. Cells were then incubated with 1:100 diluted primary Abs in blocking buffer at 4°C overnight, followed by incubation of fluorescence conjugated secondary Abs (Alexa 488 colored in green and Alexa 633 colored in red in the figures) with 1:200 dilution for 1 h at room temperature. Slides were prepared with the mounting medium containing DAPI and imaged under a Leica SP5 confocal microscopy.
Quantification of polarization of immunostained proteins in neutrophils was done as previously described (16). Briefly, if the fluorescence intensity in 25% of the cell periphery is accounted for more than 50% of the total fluorescence intensity of the cell periphery, we call the cell polarized.
For colocalization quantification, Z stack images of consecutive optical planes spaced by 0.2 μm were acquired to cover the whole-cell volume using confocal microscopy. Pearson coefficient was determined using Imaris 7.2.3. The three-dimensional (3D) images were reconstructed using Imaris 7.2.3 with a surface rendering model and further adjusted with ImageJ (v1.48K).
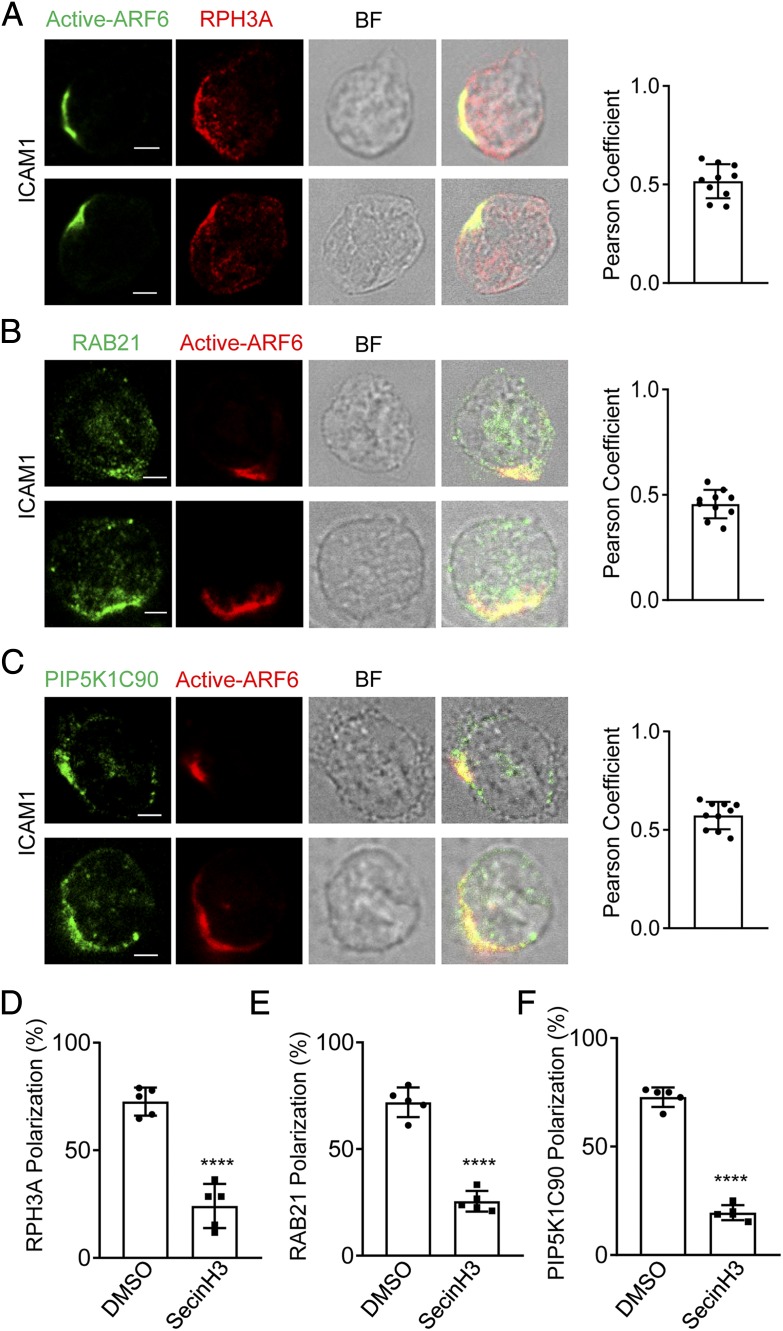
ARF6 is copolarized with RPH3A, RAB21, and PIP5K1C90 in ICAM1-stimulated neutrophils.
(A–C) Copolarization of active ARF6 with RPH3A (A), RAB21 (B), and PIP5K1C90 (C) in ICAM1 stimulated mouse neutrophils. Neutrophils attached to ICAM1 (1 μg/ml)–coated surfaces were stained with anti-active ARF6 and anti-RPH3A (A), anti-RAB21 (B), or anti-PIP5K1C90 (C), followed with Alexa 488 (green)– and Alexa 633 (red)–conjugated secondary Abs, respectively. Representative optical section images of two cells are shown. The quantification of colocalization is presented as Pearson correlation coefficient (Pearson Coefficient). Each data point represents a cell. The experiments were repeated four times. Scale bar, 3 μm. BF, bright field. (D–F) SecinH3 impairs RPH3A, RAB21, and PIP5K1C90 polarization in mouse neutrophils on the ICAM1-coated surface. Mouse neutrophils were pretreated with DMSO or 20 μM SecinH3 for 20 min at RT and then placed on an ICAM1-coated coverslip for 30 min along with the DMSO or SecinH3 treatment and subjected to immunostaining with anti-RPH3A and anti-TGN38 (D), anti-RAB21 and anti-EEA1 (E), or anti-PIP5K1C90 and anti-EEA1 (F), followed with Alexa 633 (red)– and Alexa 488 (green)–conjugated secondary Abs, respectively. Representative optical section images of two cells are shown. Quantification of polarization of RPH3A, RAB21, and PIP5K1C90 is shown in (D)–(F), respectively. Each data point represents the average of more than 15 cells per observation field, and the experiment was repeated three times. Data are present in means ± SEM (Student t test). ****p < 0.0001.
Immunocytochemistry and imaging.
Using 4% formaldehyde in PBS, utricles were fixed for 4–12 h and cochleas were fixed for 0.5–1 h. Organs were then rinsed in PBS, permeabilized for 10 min in 0.5% Triton X-100 in PBS, and blocked for 1–2 h in 2% bovine serum albumin and 5% normal goat serum in PBS. For immunolocalization of ARF6 and other membrane compartment markers, organs were permeabilized and blocked for 1 h in 5% normal goat serum and 0.2% saponin in PBS; this blocking solution was used in all subsequent antibody steps. Organs were incubated overnight at 4°C with primary antibodies diluted in blocking solution; a dilution of 1:250 was used for anti-ELMOD1 and 1:1000 for anti-acetylated tubulin (Sigma-Aldrich, T7451; RRID:AB_609894). For ARF6 and other membrane markers, the following dilutions were used: 1:100 anti-ARF6, 1:250-activated ARF6 (NewEast Biosciences, 26918; RRID:AB_2629397); 1:250 anti-clathrin heavy chain (X22, MA1-065, ThermoFisher Scientific; RRID:AB_2083179), 1:250 anti-EEA1 (3288, Cell Signaling Technology; RRID:AB_2096811), 1:250 anti-Rab11 (5589, Cell Signaling Technology; RRID:AB_10693925), 1:250 anti-Rab5 (3547, Cell Signaling Technology; RRID:AB_2300649), and 1:250 anti-LAMP1 (H4A3, Developmental Studies Hybridoma Bank; RRID:AB_2296838). Organs were then rinsed 3× for 10 min each, followed by a 3–4 h incubation in blocking solution with 1:1000 AlexaFluor secondary antibodies and 0.4 U/ml AlexaFluor 488 Phalloidin (Invitrogen). Similarly, utricles from electroporated ears were fixed and stained as above using an anti-GFP (DSHB-GFP-4C9, Developmental Studies Hybridoma Bank; RRID:AB_2617422) primary antibody and TRITC-phalloidin. Following secondary antibody incubation, organs were then rinsed 3× for 20 min each and mounted on slides in Vectashield (Vector Laboratories) using a single Secure-Seal spacer (8 wells, 0.12 mm deep; Invitrogen). Images were acquired on an Olympus Fluoview FV1000 laser scanning confocal microscope system and AF10-ASW 3.0 acquisition software, using a 60× 1.42 NA Plan Apo objective with 3× zoom and 0.4 μm z-steps. ARF6 and ARG-GTP images were collected on a Zeiss LSM 710 using either a 63× 1.4 NA Plan-Apochromat or 25× 0.8 NA Plan-Neofluar objective. Fiji software was used to adjust intensities, generate reslice stacks, and prepare stack projections. To analyze ARF6 and ARF6-GTP levels, average z-projections centered around the cuticular plate were generated for two separate areas within each 25× stack. Regions-of-interest (ROIs) surrounding the cuticular plate (as visualized by phalloidin) were generated for 40–50 cells per image, and mean intensities were measured in each channel using the multi-measure function within the ROI Manager tool in Fiji. To correct for global intensity differences between samples imaged on different days, measurements were corrected for background levels within each image and normalized to the total phalloidin average. To quantify changes in hair-cell structure during progression of the rda/rda phenotype, we scored six different morphological phenotypes on a scale of 0 (identical to control), 1 (noticeably different from control), or 2 (very noticeable). The phenotypes scored were as follows: gaps in cuticular plate actin, protrusion of apical surface, movement of the bundle toward the fonticulus, decrease in bundle cross-sectional area, increase in the proportion of long stereocilia in a bundle, and fusion of stereocilia. For analysis of morphological changes, we analyzed a mixture of type I and type II hair cells. To analyze the correlation between ARF6-GTP level and phenotype, ROIs were generated around the cuticular plate region of 40 cells within each 63× stack and ARF6-GTP intensities were measured using Fiji; measurements from two separate experiments with images from two utricles per condition were acquired.
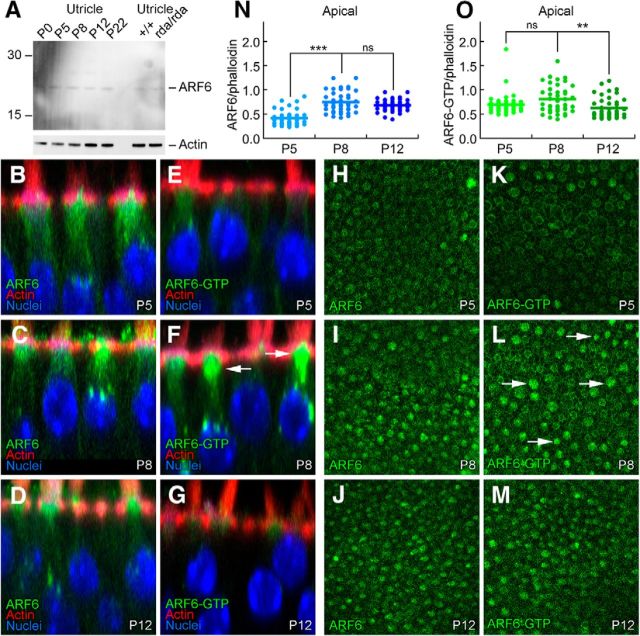
ARF6 and ARF6-GTP during hair bundle development.
A, Immunoblot detection of ARF6. Total ARF6 levels are constant during postnatal utricle development, and are unchanged in rda/rda hair cells. Blot was probed separately for actin (below). B–G, ARF6 and ARF6-GTP immunolabeling in profile views of C57BL/6 utricles during development. Little change in ARF6, but ARF6-GTP is elevated in some hair cells at P8. Panel sizes: 30 × 30 μm. H–M, ARF6 and ARF6-GTP immunolabeling in cross-sections of C57BL/6 utricles at the cell apex (cuticular-plate level) during development. Arrows indicate cells with higher levels of ARF6-GTP. Panel sizes: 100 × 100 μm. N, Immunocytochemistry quantitation of ARF6 levels relative to phalloidin. O, Immunocytochemistry quantitation of ARF6-GTP levels relative to phalloidin. ***p < 0.001; **p < 0.01; ns, Not significant.
Immunocytochemistry and imaging.
Using 4% formaldehyde in PBS, utricles were fixed for 4–12 h and cochleas were fixed for 0.5–1 h. Organs were then rinsed in PBS, permeabilized for 10 min in 0.5% Triton X-100 in PBS, and blocked for 1–2 h in 2% bovine serum albumin and 5% normal goat serum in PBS. For immunolocalization of ARF6 and other membrane compartment markers, organs were permeabilized and blocked for 1 h in 5% normal goat serum and 0.2% saponin in PBS; this blocking solution was used in all subsequent antibody steps. Organs were incubated overnight at 4°C with primary antibodies diluted in blocking solution; a dilution of 1:250 was used for anti-ELMOD1 and 1:1000 for anti-acetylated tubulin (Sigma-Aldrich, T7451; RRID:AB_609894). For ARF6 and other membrane markers, the following dilutions were used: 1:100 anti-ARF6, 1:250-activated ARF6 (NewEast Biosciences, 26918; RRID:AB_2629397); 1:250 anti-clathrin heavy chain (X22, MA1-065, ThermoFisher Scientific; RRID:AB_2083179), 1:250 anti-EEA1 (3288, Cell Signaling Technology; RRID:AB_2096811), 1:250 anti-Rab11 (5589, Cell Signaling Technology; RRID:AB_10693925), 1:250 anti-Rab5 (3547, Cell Signaling Technology; RRID:AB_2300649), and 1:250 anti-LAMP1 (H4A3, Developmental Studies Hybridoma Bank; RRID:AB_2296838). Organs were then rinsed 3× for 10 min each, followed by a 3–4 h incubation in blocking solution with 1:1000 AlexaFluor secondary antibodies and 0.4 U/ml AlexaFluor 488 Phalloidin (Invitrogen). Similarly, utricles from electroporated ears were fixed and stained as above using an anti-GFP (DSHB-GFP-4C9, Developmental Studies Hybridoma Bank; RRID:AB_2617422) primary antibody and TRITC-phalloidin. Following secondary antibody incubation, organs were then rinsed 3× for 20 min each and mounted on slides in Vectashield (Vector Laboratories) using a single Secure-Seal spacer (8 wells, 0.12 mm deep; Invitrogen). Images were acquired on an Olympus Fluoview FV1000 laser scanning confocal microscope system and AF10-ASW 3.0 acquisition software, using a 60× 1.42 NA Plan Apo objective with 3× zoom and 0.4 μm z-steps. ARF6 and ARG-GTP images were collected on a Zeiss LSM 710 using either a 63× 1.4 NA Plan-Apochromat or 25× 0.8 NA Plan-Neofluar objective. Fiji software was used to adjust intensities, generate reslice stacks, and prepare stack projections. To analyze ARF6 and ARF6-GTP levels, average z-projections centered around the cuticular plate were generated for two separate areas within each 25× stack. Regions-of-interest (ROIs) surrounding the cuticular plate (as visualized by phalloidin) were generated for 40–50 cells per image, and mean intensities were measured in each channel using the multi-measure function within the ROI Manager tool in Fiji. To correct for global intensity differences between samples imaged on different days, measurements were corrected for background levels within each image and normalized to the total phalloidin average. To quantify changes in hair-cell structure during progression of the rda/rda phenotype, we scored six different morphological phenotypes on a scale of 0 (identical to control), 1 (noticeably different from control), or 2 (very noticeable). The phenotypes scored were as follows: gaps in cuticular plate actin, protrusion of apical surface, movement of the bundle toward the fonticulus, decrease in bundle cross-sectional area, increase in the proportion of long stereocilia in a bundle, and fusion of stereocilia. For analysis of morphological changes, we analyzed a mixture of type I and type II hair cells. To analyze the correlation between ARF6-GTP level and phenotype, ROIs were generated around the cuticular plate region of 40 cells within each 63× stack and ARF6-GTP intensities were measured using Fiji; measurements from two separate experiments with images from two utricles per condition were acquired.
ELMOD1 is an ARF6 GAP in hair cells.
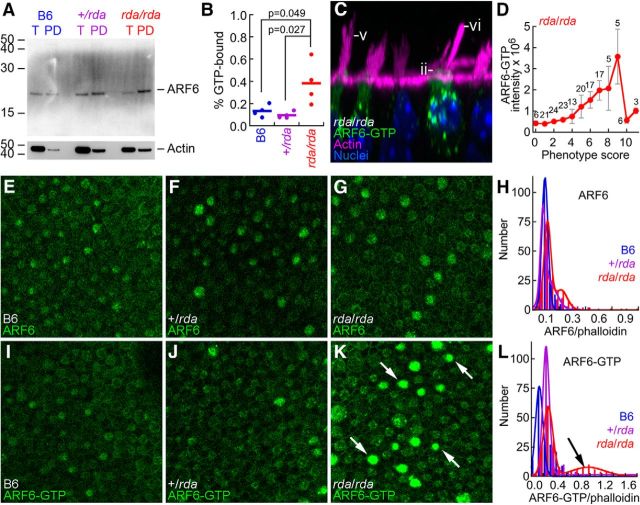
A, Immunoblot showing total ARF6 (T) or ARF6-GTP pulled down with PBD-GGA3 (PD) from B6, +/rda, and rda/rda utricle extracts. Blot was reprobed for actin (below). T, Total material; PD, pulldown. Equal fractions of each sample were loaded, allowing direct comparison band intensity. B, Summed data from four PBD-GGA3 pulldown experiments. The fraction of ARF6 in the GTP-bound state was significantly elevated in rda/rda utricles compared with either +/rda or B6 utricles. C, The rda/rda phenotype is most pronounced in cells with high ARF6-GTP levels; examples of the rda/rda phenotype are shown. Morphology phenotypes are the same as for Figure 4: (Dii) apical cytoplasmic protrusion, (Dv) high proportion of long stereocilia in bundles, and (Dvi) fused and elongated stereocilia. Panel is 37 × 37 μm. D, Correlation of summed phenotype score against average ARF6-GTP intensity. For a given cell, phenotype scores (0–2 scale) were summed for all six phenotype features (mean ± SEM; number of cells with a given phenotype score are indicated above data points). E–L, Examples of immunocytochemistry at cuticular-plate level of hair cells for ARF6 (E–G) or ARF6-GTP (I–K), as well as quantitation of the immunocytochemistry data (H, L). K, Arrows indicate rda/rda cells with high levels of ARF6-GTP. All immunocytochemistry panels are 100 × 100 μm. H, L, ARF6 or ARF6-GTP signal was normalized by the phalloidin signal, then distributions were fit with double Gaussians. L, Arrow indicates the large population of rda/rda hair cells with high levels of ARF6-GTP. +/rda and B6 mice had smaller populations of high-expressing cells.
Immunohistochemistry
Immunohistochemistry of kidney sections was performed as described earlier, with modifications (The Jackson Laboratory). Briefly, kidneys were fixed with 4% paraformaldehyde for 2 h and transferred to a 18% sucrose solution for 12–16 h. Subsequently, kidneys were placed in a cryomold and embedded in cryomatrix gel (Thermo Scientific, Waltham, MA) prior to freezing. Frozen samples were sectioned (10 μm thick) using a Leica CM1950 Cryostat, and directly mounted on slides for subsequent immunostaining procedures. Kidney sections were allowed to thaw at room temperature (rt), washed once with PBS and fixed with ice-cold acetone for 10 min. Samples were then washed three times with PBS for 5 min each and blocked in PBS containing 1% BSA for 1 h. Next, sections were incubated with primary antibodies specific for Arf6-GTP (Anti-Active Arf6 Mouse Monoclonal Antibody, catalog # 26918 NewEast Biosciences, Malvern, PA) or against Rac1-GTP (Anti-Active Rac1-GTP Mouse Monoclonal Antibody catalog # 26903, NewEast Biosciences) plus or minus primary antibody against aquaporin 1 (Aqp1) (Millipore). After incubation overnight at 4°C with the primary antibodies, tissues were washed three times 5 min each with PBS and incubated with an anti-mouse Alexa Fluor 488 antibody (Jackson ImmunoResearch Laboratories Inc., West Grove, PA) plus or minus anti-rabbit Alexa Fluor 546 (Jackson ImmunoResearch Laboratories Inc) for 1 h at rt. Subsequently, sections were washed three times 5 min each with PBS and, prior mounting tissue was incubated with Alexa Fluor 647 phalloidin (Invitrogen, Grand Island, NY) for 15 min at rt to stain for F-actin.
The efficacy of the anti GTP-Arf6 antibody to specifically detect active Arf6 was tested in vitro by staining of HeLa cells transfected with HA-tagged Arf6-Q67L (GTP Arf6) or with HA-tagged Arf6-T27N (GDP-Arf6) (Fig. S1), and the anti GTP-Rac1 antibody’s selectivity has been tested elsewhere (Jiang et al. 2015). Tissues were mounted using Prolong Gold antifade agent (Invitrogen) and visualized in a confocal microscope (Zeiss LSM510, Thornwood, NY). As a control, tissue samples were incubated with the secondary antibody only.
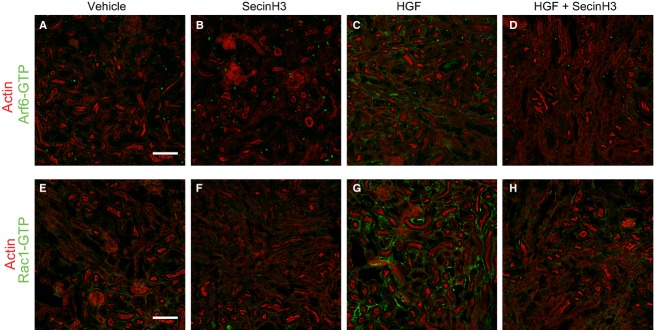
Cytohesins are required to promote HGF-induced activation of Rac1 and Arf6 in injured kidney. Mice were subjected to IRI and treated with either HGF, SecinH3 or a combination of both every 24 h for 96 h. Injured kidneys were then harvested, cryosectioned (10 mm), and stained either against active Arf6 (panels A–D) or GTP-Rac1 (panels E–H), and costained with Alexa Fluor 647 phalloidin to detect F-actin. Tissues derive from: (A and E) IRI-untreated mice, (B and F) SecinH3-treated IRI mice, (C and G) HGF-treated IRI mice or, (D and H) HGF and SecinH3-treated IRI mice. The scale bars represent 100 μm.
Immunohistochemistry
Immunohistochemistry of kidney sections was performed as described earlier, with modifications (The Jackson Laboratory). Briefly, kidneys were fixed with 4% paraformaldehyde for 2 h and transferred to a 18% sucrose solution for 12–16 h. Subsequently, kidneys were placed in a cryomold and embedded in cryomatrix gel (Thermo Scientific, Waltham, MA) prior to freezing. Frozen samples were sectioned (10 μm thick) using a Leica CM1950 Cryostat, and directly mounted on slides for subsequent immunostaining procedures. Kidney sections were allowed to thaw at room temperature (rt), washed once with PBS and fixed with ice-cold acetone for 10 min. Samples were then washed three times with PBS for 5 min each and blocked in PBS containing 1% BSA for 1 h. Next, sections were incubated with primary antibodies specific for Arf6-GTP (Anti-Active Arf6 Mouse Monoclonal Antibody, catalog # 26918 NewEast Biosciences, Malvern, PA) or against Rac1-GTP (Anti-Active Rac1-GTP Mouse Monoclonal Antibody catalog # 26903, NewEast Biosciences) plus or minus primary antibody against aquaporin 1 (Aqp1) (Millipore). After incubation overnight at 4°C with the primary antibodies, tissues were washed three times 5 min each with PBS and incubated with an anti-mouse Alexa Fluor 488 antibody (Jackson ImmunoResearch Laboratories Inc., West Grove, PA) plus or minus anti-rabbit Alexa Fluor 546 (Jackson ImmunoResearch Laboratories Inc) for 1 h at rt. Subsequently, sections were washed three times 5 min each with PBS and, prior mounting tissue was incubated with Alexa Fluor 647 phalloidin (Invitrogen, Grand Island, NY) for 15 min at rt to stain for F-actin.
The efficacy of the anti GTP-Arf6 antibody to specifically detect active Arf6 was tested in vitro by staining of HeLa cells transfected with HA-tagged Arf6-Q67L (GTP Arf6) or with HA-tagged Arf6-T27N (GDP-Arf6) (Fig. S1), and the anti GTP-Rac1 antibody’s selectivity has been tested elsewhere (Jiang et al. 2015). Tissues were mounted using Prolong Gold antifade agent (Invitrogen) and visualized in a confocal microscope (Zeiss LSM510, Thornwood, NY). As a control, tissue samples were incubated with the secondary antibody only.
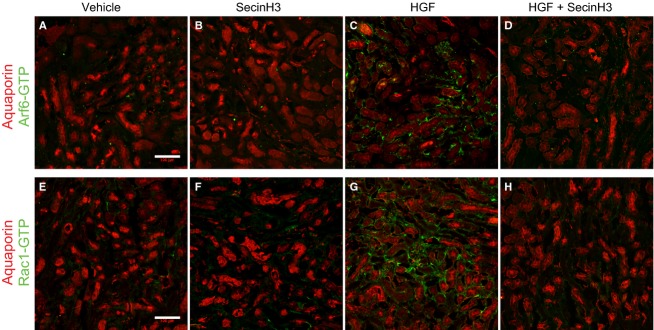
HGF-induced activation of Rac1 and Arf6 in injured kidney occurs mainly at the proximal tubules. Mice were subjected to IRI and treated with either HGF, SecinH3 or a combination of both every 24 h for 96 h. Injured kidneys were then harvested, cryosectioned (10 mm), and incubated with either against active Arf6 (panels A–D) or GTP-Rac1 (panels E–H), and costained with rabbit anti aquaporin-1. Next, sections were stained with anti-mouse Alexa Fluor 488 and anti-rabbit Alexa Fluor 546. Tissues derive from: (A and E) IRI-untreated mice, (B and F) SecinH3-treated IRI mice, (C and G) HGF-treated IRI mice or, (D and H) HGF and SecinH3-treated IRI mice. The scale bars represent 100 μm.
Immunohistochemistry
Immunohistochemistry of kidney sections was performed as described earlier, with modifications (The Jackson Laboratory). Briefly, kidneys were fixed with 4% paraformaldehyde for 2 h and transferred to a 18% sucrose solution for 12–16 h. Subsequently, kidneys were placed in a cryomold and embedded in cryomatrix gel (Thermo Scientific, Waltham, MA) prior to freezing. Frozen samples were sectioned (10 μm thick) using a Leica CM1950 Cryostat, and directly mounted on slides for subsequent immunostaining procedures. Kidney sections were allowed to thaw at room temperature (rt), washed once with PBS and fixed with ice-cold acetone for 10 min. Samples were then washed three times with PBS for 5 min each and blocked in PBS containing 1% BSA for 1 h. Next, sections were incubated with primary antibodies specific for Arf6-GTP (Anti-Active Arf6 Mouse Monoclonal Antibody, catalog # 26918 NewEast Biosciences, Malvern, PA) or against Rac1-GTP (Anti-Active Rac1-GTP Mouse Monoclonal Antibody catalog # 26903, NewEast Biosciences) plus or minus primary antibody against aquaporin 1 (Aqp1) (Millipore). After incubation overnight at 4°C with the primary antibodies, tissues were washed three times 5 min each with PBS and incubated with an anti-mouse Alexa Fluor 488 antibody (Jackson ImmunoResearch Laboratories Inc., West Grove, PA) plus or minus anti-rabbit Alexa Fluor 546 (Jackson ImmunoResearch Laboratories Inc) for 1 h at rt. Subsequently, sections were washed three times 5 min each with PBS and, prior mounting tissue was incubated with Alexa Fluor 647 phalloidin (Invitrogen, Grand Island, NY) for 15 min at rt to stain for F-actin.
The efficacy of the anti GTP-Arf6 antibody to specifically detect active Arf6 was tested in vitro by staining of HeLa cells transfected with HA-tagged Arf6-Q67L (GTP Arf6) or with HA-tagged Arf6-T27N (GDP-Arf6) (Fig. S1), and the anti GTP-Rac1 antibody’s selectivity has been tested elsewhere (Jiang et al. 2015). Tissues were mounted using Prolong Gold antifade agent (Invitrogen) and visualized in a confocal microscope (Zeiss LSM510, Thornwood, NY). As a control, tissue samples were incubated with the secondary antibody only.
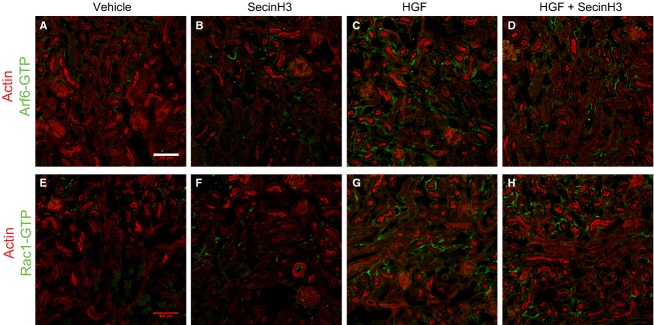
HGF induces the activation of Rac1 and Arf6 in damaged kidneys early after reperfusion. Mice were subjected to IRI and treated with either HGF, SecinH3 or a combination of both 24 h after reperfusion. Injured kidneys were then harvested 24 h after treatment, cryosectioned (10 mm), and stained either against GTP-Arf6 (panels A–D) or GTP-Rac1 (panels E–H), and costained with Alexa Fluor 647 phalloidin to detect F-actin. Tissues derive from: (A and E) IRI-untreated mice, (B and F) SecinH3-treated IRI mice, (C and G) HGF-treated IRI mice or, (D and H) HGF and SecinH3-treated IRI mice. The scale bars represent 100 μm.
Immunocytochemistry
Cells were fixed for 10 min in 4% formaldehyde/4% sucrose in PBS. Fixed cells were permeabilized and blocked simultaneously in PBS containing 2%−4% normal goat serum and 0.2% Triton-X-100 for 1 hr at room temperature. Primary antibodies were added in PBS containing 2% normal goat serum overnight at 4 °C, followed by 3 × 10 min washes in PBS. Secondary antibodies were incubated for 1 hr at room temp, also in 2%−4% normal goat serum in PBS. Three further washes (15 min each) were performed before coverslips were mounted using ProLong antifade reagent (Life Technologies).
To label surface GluA1 in neurons, we incubated live cells with antibody to the extracellular N-terminus of GluA1 at 4 °C for 30 min. Cells were fixed for 10 min in 4% formaldehyde/4% sucrose in PBS and were then processed for immunostaining as described above. For surface and total labeling of GluA1 in N2A cells, cells were first fixed in 4%paraformaldehyde in PBS for 5 min and blocked in PBS containing 4% normal goat serum (without permeabilization). Cells were incubated with N-terminal GluA1 antibody for 1 hour in PBS + 4% normal goat serum and washed three times before being permeabilized as above and further stained for total GluA1 with C-terminal GluA1 antibody overnight at 4 °C. Cells were then processed using the secondary staining and mounting described above.
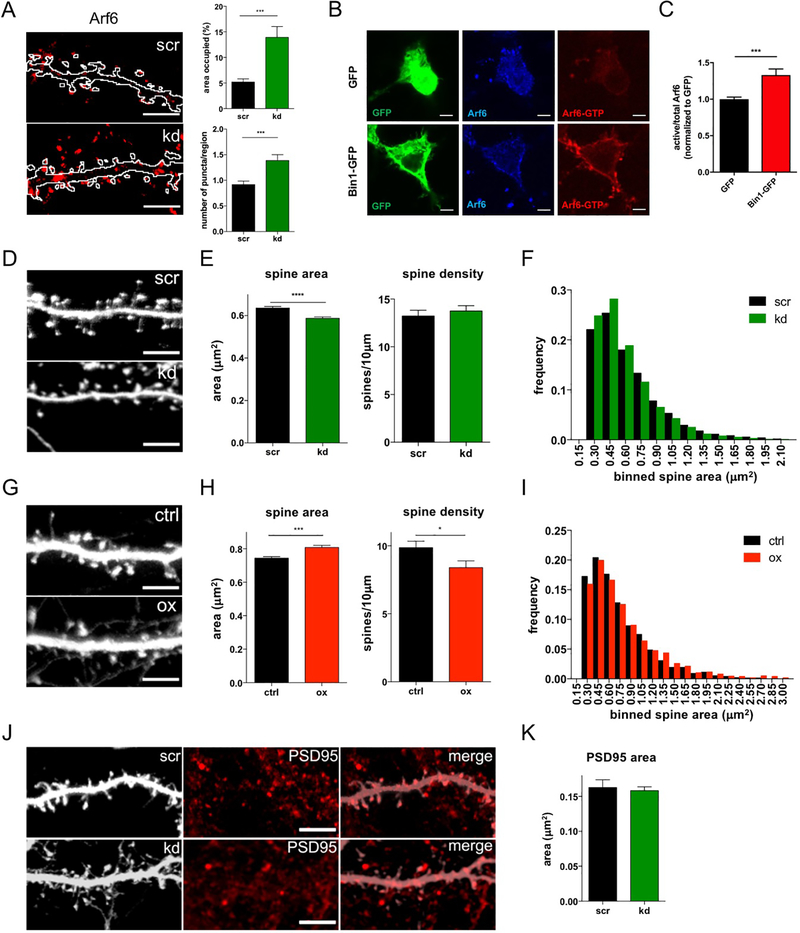
Bin1 regulates Arf6 and dendritic spine morphology
(B) Representative single plane confocal images showing total and active Arf6 staining in N2A cells with and without Bin1-GFP transfection. Scale bar = 5 μm
(C) Quantification of active/total Arf6 ratio in N2A cells transfected with GFP (n=16 cells) or Bin1-GFP (n=16 cells). All results were normalized to the average of the value of GFP transfection condition for each experiment. Mann-Whitney test *** P<0.001
Immunoprecipitation
293T cells transfected with indicated plasmids were lysed in lysis buffer (20 mM Hepes, pH 7.4, 150 mM NaCl, 1mM EDTA, 0.1% Triton X-100) at 4°C. Lysates were clarified by centrifugation at 12000 rpm for 20 min at 4°C and then incubated with FLAG M2 beads (Sigma) at 4°C for 4 h. After washed with Hepes buffer for three times, the beads were boiled in SDS-PAGE sample buffer for 10 min. The bound proteins were separated by SDS-PAGE and immunoblotted with the indicated antibodies.
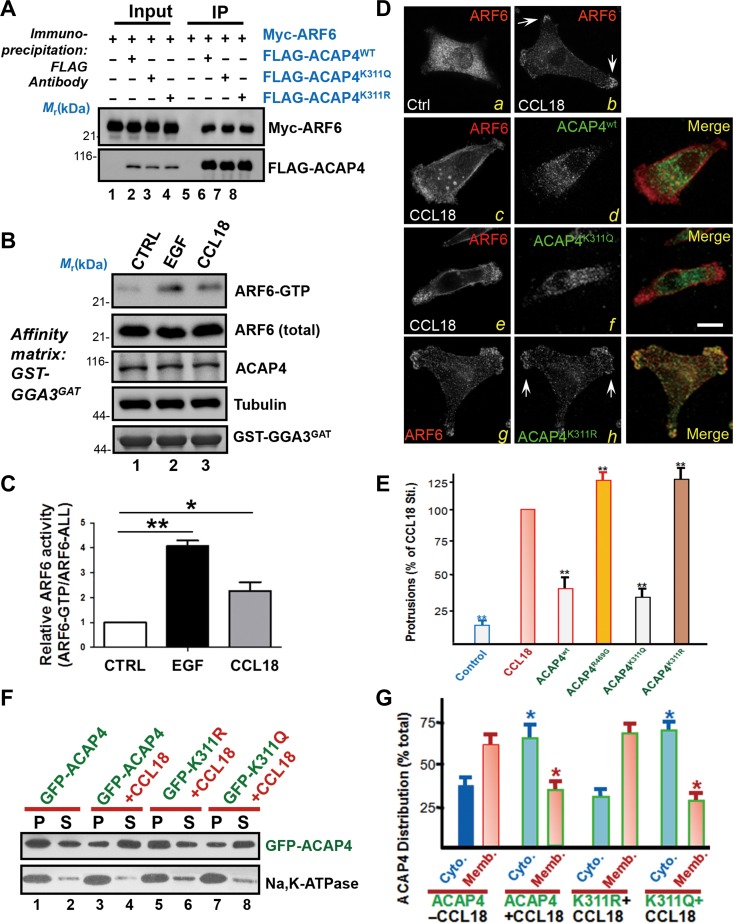
CCL18-elicited acetylation promotes ARF6 GTPase activity via dissociation of ACAP4 from the plasma membrane.
(A) Co-immunoprecipitation of Myc-ARF6 and FLAG-ACAP4 wild-type or variants. 293T cells were transfected with Myc-ARF6 plus FLAG-ACAP4 wild-type (WT) or variants (K311Q/R). Twenty-four hours after transfection, cells were lysed and incubated with the FLAG M2 beads for 2 h. Then the beads were washed and analyzed by western blotting with anti-Myc and anti-FLAG antibodies. (B) Endogenous ARF6 activity was measured by GGA3 pull-down assay with CCL18 simulation. MDA-MB-231 cells were subjected to serum starvation followed by stimulation with 20 ng/ml CCL18 for 10 min or 0.1 μg/ml EGF for 5 min. The stimulated cells were incubated with the GST-GGA3GAT. Active forms of ARF6 were measured by anti-ARF6-GTP blot. (C) Quantitative analyses on the ratio of ARF6-GTP/ARF6-ALL described in B.
Immunoprecipitation
293T cells transfected with indicated plasmids were lysed in lysis buffer (20 mM Hepes, pH 7.4, 150 mM NaCl, 1mM EDTA, 0.1% Triton X-100) at 4°C. Lysates were clarified by centrifugation at 12000 rpm for 20 min at 4°C and then incubated with FLAG M2 beads (Sigma) at 4°C for 4 h. After washed with Hepes buffer for three times, the beads were boiled in SDS-PAGE sample buffer for 10 min. The bound proteins were separated by SDS-PAGE and immunoblotted with the indicated antibodies.
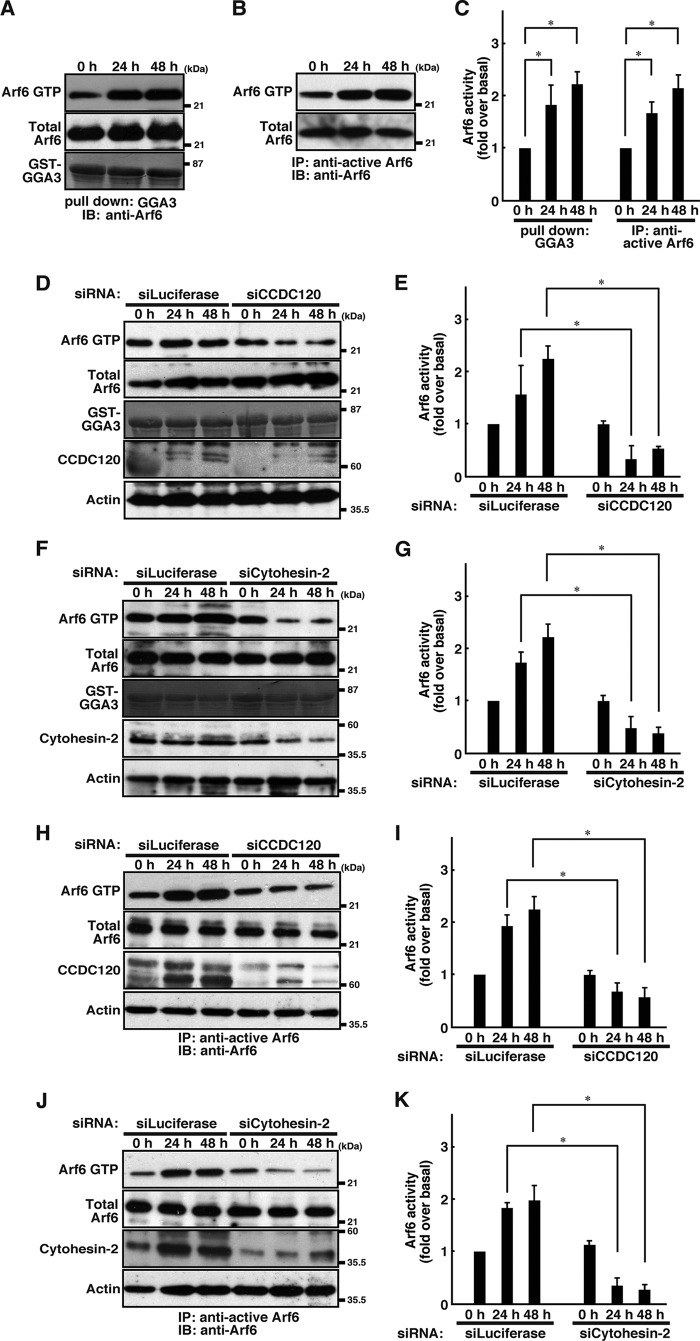
CCDC120 and cytohesin-2 is involved in Arf6 activation in N1E-115 cells.
A, N1E-115 cells were treated with serum-free medium for 0, 24, or 48 h. After treatment, cells were lysed using lysis buffer. Cell lysates were affinity-precipitated with a recombinant GST-GGA3 and then immunoblotted with an anti-Arf6 antibody, respectively. B, N1E-115 cells were treated with serum-free medium for 0, 24, or 48 h. After treatment, cells were lysed using lysis buffer. Cell lysates were immunoprecipitated (IP) with an anti-active Arf6 antibody and then immunoblotted (IB) with an anti-Arf6 antibody. C, quantification of Arf6 activity from three independent experiments similar to that shown in A or B, respectively. Data were evaluated using a one-way ANOVA (*, p < 0.01; n = 3). D and E, N1E-115 cells were transfected with an siRNA for control luciferase or CCDC120 and allowed to differentiate for 0, 24, or 48 h. Arf6 activity was measured with affinity precipitation with GST-GGA3. The expression levels of Arf6, CCDC120, and actin and Coomassie staining of GST-GGA3 were also shown. F and G, N1E-115 cells transfected with an siRNA for control luciferase or cytohesin-2 was allowed to differentiate for 0, 24, or 48 h, and Arf6 activity was measured. Data were evaluated using a one-way ANOVA (*, p < 0.01; n = 3). H and I, N1E-115 cells were transfected with an siRNA for control luciferase or CCDC120 and allowed to differentiate for 0, 24, or 48 h. After treatment, cells were lysed using lysis buffer. Cell lysates were immunoprecipitated with an anti-active Arf6 antibody and then immunoblotted with an anti-Arf6 antibody. The expression levels of Arf6, CCDC120, and actin were shown. J and K, N1E-115 cells were transfected with an siRNA for control luciferase or cytohesin-2 and allowed to differentiate for 0, 24, or 48 h. After treatment, cells were lysed using lysis buffer. Cell lysates were immunoprecipitated with an anti-active Arf6 antibody and then immunoblotted with an anti-Arf6 antibody. The expression levels of Arf6, cytohesin-2, and actin are shown.
Immunofluorescence
Cells were fixed in 4% paraformaldehyde in PBS, blocked with 20% heat-inactivated FBS in PBS, 0.05% Tween 20, incubated with each of the primary antibodies, and treated with fluorescence-labeled secondary antibodies in PBS containing 0.1% Tween 20. The coverslips were mounted onto slides with the Vectashield reagent (Vector Laboratories, Burlingame, CA) for observation using confocal microscopy. The confocal images were collected using an IX81 microscope with a laser-scanning FV1000 system (Olympus, Tokyo, Japan) and analyzed using FluoView software version 3.1 (Olympus).
Immunoblotting
Cells were lysed in lysis buffer B (50 mm HEPES-NaOH (pH 7.5), 20 mm MgCl2, 150 mm NaCl, 1 mm dithiothreitol, 1 mm phenylmethanesulfonyl fluoride, 1 μg/ml leupeptin, 1 mm EDTA, 1 mm Na3VO4, 10 mm NaF, and 0.5% Nonidet P-40), and the lysates were centrifuged at 14,000 rpm for 10 min at 4 °C. The proteins in the supernatants were denatured in Laemmli sample buffer (0.4 m Tris-HCl (pH 6.8), 0.2 m dithiothreitol, 0.2% bromphenol blue, and 4% SDS) and then subjected to SDS-PAGE. The electrophoretically separated proteins were transferred to a PVDF membrane, blocked with the Blocking-One reagent (Nacalai Tesque, Kyoto, Japan), and immunoblotted with each of the primary antibodies and in turn with peroxidase-conjugated secondary antibodies. The bound antibodies were detected using the ChemiLumi-One reagent (Nacalai Tesque) or ECL select Western blotting detection system (GE Healthcare).
Immunoprecipitation
Cell lysates were mixed with protein G resin preadsorbed with each of the primary antibodies. The immune complexes were precipitated by centrifugation and washed three times using lysis buffer B. The immunoprecipitates were boiled in sample buffer and then separated on SDS-polyacrylamide gels. The bound proteins were detected using immunoblotting.
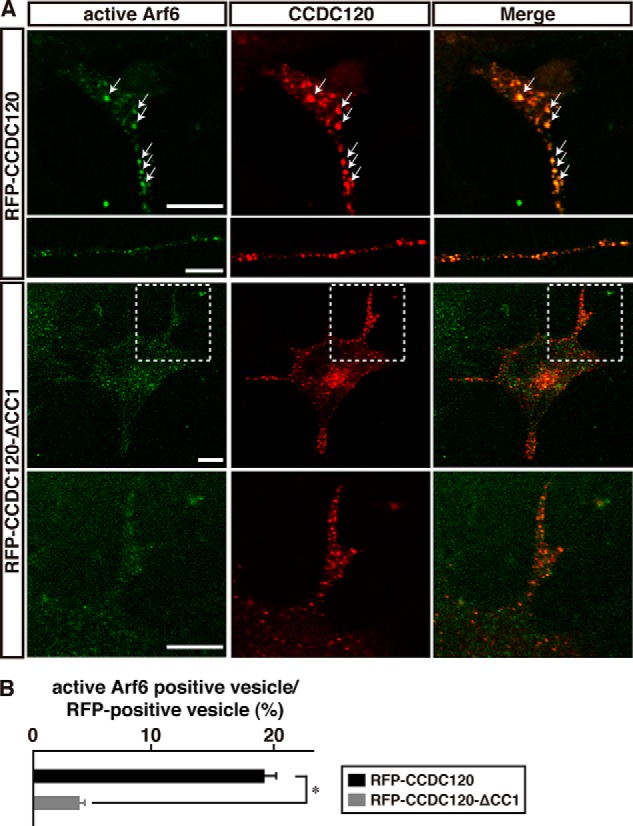
Interaction between CCDC120 and cytohesin-2 is required for both neurite growth and Arf6 activation.
A, at 48 h following differentiation, N1E-115 cells expressing RFP-CCDC120 or RFP-CCDC120-ΔCC1 were immunostained with an anti-active Arf6 antibody. In RFP-CCDC120-ΔCC1 panels, enlarged photographs of dotted squares in upper panels are shown in the lower panels. Scale bars, 5 μm. B, percentage of active Arf6-positive vesicles in CCDC120-positive vesicles in neurites is shown (n = 25 neurites in each experiment). Data were evaluated using a one-way ANOVA (*, p < 0.01).
PSD3 and active ARF6 immunohistochemistry
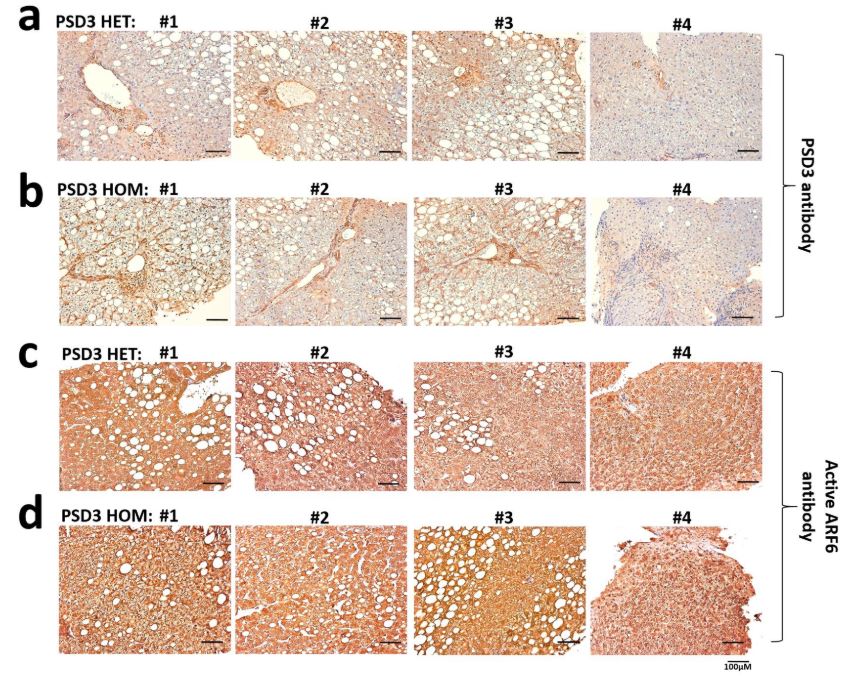
Immunostaining for PSD3 and active ARF6 was performed on formalin-fixed and paraffin-embedded liver specimens from eight patients with NAFLD from the LBC (n = 4 heterozygotes (L186T) and n = 4 homozygotes for the 186L allele of the PSD3 gene). The automated Ventana BenchMark ULTRA IHC/ISH Staining Module (Ventana) was used together with the Ultraview 3,3′-diaminobenzidine v.1 detection system (Ventana). Tissue sections (4 µm) were deparaffinized (at 72 °C) and incubated in EZPrep Volume Adjust (Ventana). At intervals, steps slides were washed with a cell conditioning solution, Cell Conditioner 1, Tris–EDTA-based buffer, pH 7.8. For analysis of PSD3, sections were first incubated with ultraviolet inhibitor blocking solution for 4 min at 36 °C, then with the protease 1 for 4 min at 36 °C, and finally with anti-PSD3 primary antibody (29-749, dilution 1:100; ProSci) for 1 h at room temperature. For analysis of ARF6, a heat-induced antigen retrieval protocol set for 56 min at 91 °C was carried out using a Tris–EDTA–boric acid, pH 8.4, buffer (Cell Conditioner 1). Sections were incubated with ultraviolet inhibitor blocking solution for 4 min and then with anti-activated ARF6 primary antibody (26918, dilution 1:200; NewEast Biosciences) for 1 h and 4 min at room temperature. For both analyses, incubation with horseradish peroxidase-linked secondary antibody (8 min) (1706515 for PSD3, dilution 1:100, and 170-6516 for active ARF6, dilution 1:150; both Bio-Rad) was followed by incubation with 3,3′-diaminobenzidine chromogen and substrate (8 min) and copper enhancer (4 min). Counterstain (haematoxylin) was applied for 12 min before 4-min incubation with bluing reagent.
Stained tissue sections were analysed under an optical microscope by a pathologist who was blinded to the PSD3 genotype.
Immunostaining was performed on formalin-fixed and paraffin embedded liver specimens from eight individuals with NAFLD, n=4 heterozygotes (T186L) and n=4 homozygotes for the (186L) allele of the PSD3 gene. Sections were immunostained with anti-PSD3 and anti-activated ARF6 antibodies according to standard procedures as described in materials and methods. Representative histological slides of PSD3 staining of (a) heterozygote (T186L) and (b) homozygote (186L). Corresponding active ARF6 staining of (c) heterozygote (T186L) and (d) homozygote (186L). Experiment performed independently in 4 heterozygote(T186L) and 4 homozygote(T186T) individuals and representative staining images shown for all individuals, as denoted by #1,#2;#3 and #4.
PSD3 and active ARF6 immunohistochemistry
Immunostaining for PSD3 and active ARF6 was performed on formalin-fixed and paraffin-embedded liver specimens from eight patients with NAFLD from the LBC (n = 4 heterozygotes (L186T) and n = 4 homozygotes for the 186L allele of the PSD3 gene). The automated Ventana BenchMark ULTRA IHC/ISH Staining Module (Ventana) was used together with the Ultraview 3,3′-diaminobenzidine v.1 detection system (Ventana). Tissue sections (4 µm) were deparaffinized (at 72 °C) and incubated in EZPrep Volume Adjust (Ventana). At intervals, steps slides were washed with a cell conditioning solution, Cell Conditioner 1, Tris–EDTA-based buffer, pH 7.8. For analysis of PSD3, sections were first incubated with ultraviolet inhibitor blocking solution for 4 min at 36 °C, then with the protease 1 for 4 min at 36 °C, and finally with anti-PSD3 primary antibody (29-749, dilution 1:100; ProSci) for 1 h at room temperature. For analysis of ARF6, a heat-induced antigen retrieval protocol set for 56 min at 91 °C was carried out using a Tris–EDTA–boric acid, pH 8.4, buffer (Cell Conditioner 1). Sections were incubated with ultraviolet inhibitor blocking solution for 4 min and then with anti-activated ARF6 primary antibody (26918, dilution 1:200; NewEast Biosciences) for 1 h and 4 min at room temperature. For both analyses, incubation with horseradish peroxidase-linked secondary antibody (8 min) (1706515 for PSD3, dilution 1:100, and 170-6516 for active ARF6, dilution 1:150; both Bio-Rad) was followed by incubation with 3,3′-diaminobenzidine chromogen and substrate (8 min) and copper enhancer (4 min). Counterstain (haematoxylin) was applied for 12 min before 4-min incubation with bluing reagent.
Stained tissue sections were analysed under an optical microscope by a pathologist who was blinded to the PSD3 genotype.
Immunostaining was performed on formalin-fixed and paraffin embedded liver specimens from eight individuals with NAFLD, n=4 heterozygotes (T186L) and n=4 homozygotes for the (186L) allele of the PSD3 gene. Sections were immunostained with anti-PSD3 and anti-activated ARF6 antibodies according to standard procedures as described in materials and methods. Representative histological slides of PSD3 staining of (a) heterozygote (T186L) and (b) homozygote (186L). Corresponding active ARF6 staining of (c) heterozygote (T186L) and (d) homozygote (186L). Experiment performed independently in 4 heterozygote(T186L) and 4 homozygote(T186T) individuals and representative staining images shown for all individuals, as denoted by #1,#2;#3 and #4.